 bowenliang123
97a2d9aa6c
The context tab always showed less than the official chat context
indicator because the two sides used different rulers: the plugin
displayed its fixed-density heuristic total (4 chars/token, which
systematically undercounts CJK text and JSON schemas by ~10-15%),
while the official ring shows provider-reported billed tokens. The
running host also predated the occupancy feature entirely, so the
client fell back to the raw heuristic headline.

Core change: totals are anchored to the provider sample, heuristics
only supply the composition ratios (the official ContextMeter's own
trick):

- host: fold a contextPressure-equivalent occupancy projection
  (pressureTokens / sampledSurfaceTokens / occupancyWindow) and serve
  it on the snapshot; usage is sampled BEFORE the message joins the
  surface, and streamed assistant/chunk usage samples count too, so
  steps that fail mid-stream no longer fall back to pure heuristics.
- client: headline = occupancy.projectedTokens, with a last-request
  fallback deriving the same figure against older hosts (a page
  refresh fixes the live view before any server restart).
- composition bar, legend and trend bars are re-proportioned to the
  anchored total (ratios stay heuristic, values marked ≈); the
  conflicting 'estimate ≈ n (~p%)' second percentage is gone.

Verified by tests/diff-fold.mjs (kept as a differential regression
tool): the plugin's occupancy equals the official
contextPressure.projectedTokens to the token on all 33 real session
logs, incl. a 17k-event log with 9 compactions and a chunk-only-usage
session.
dsh-context


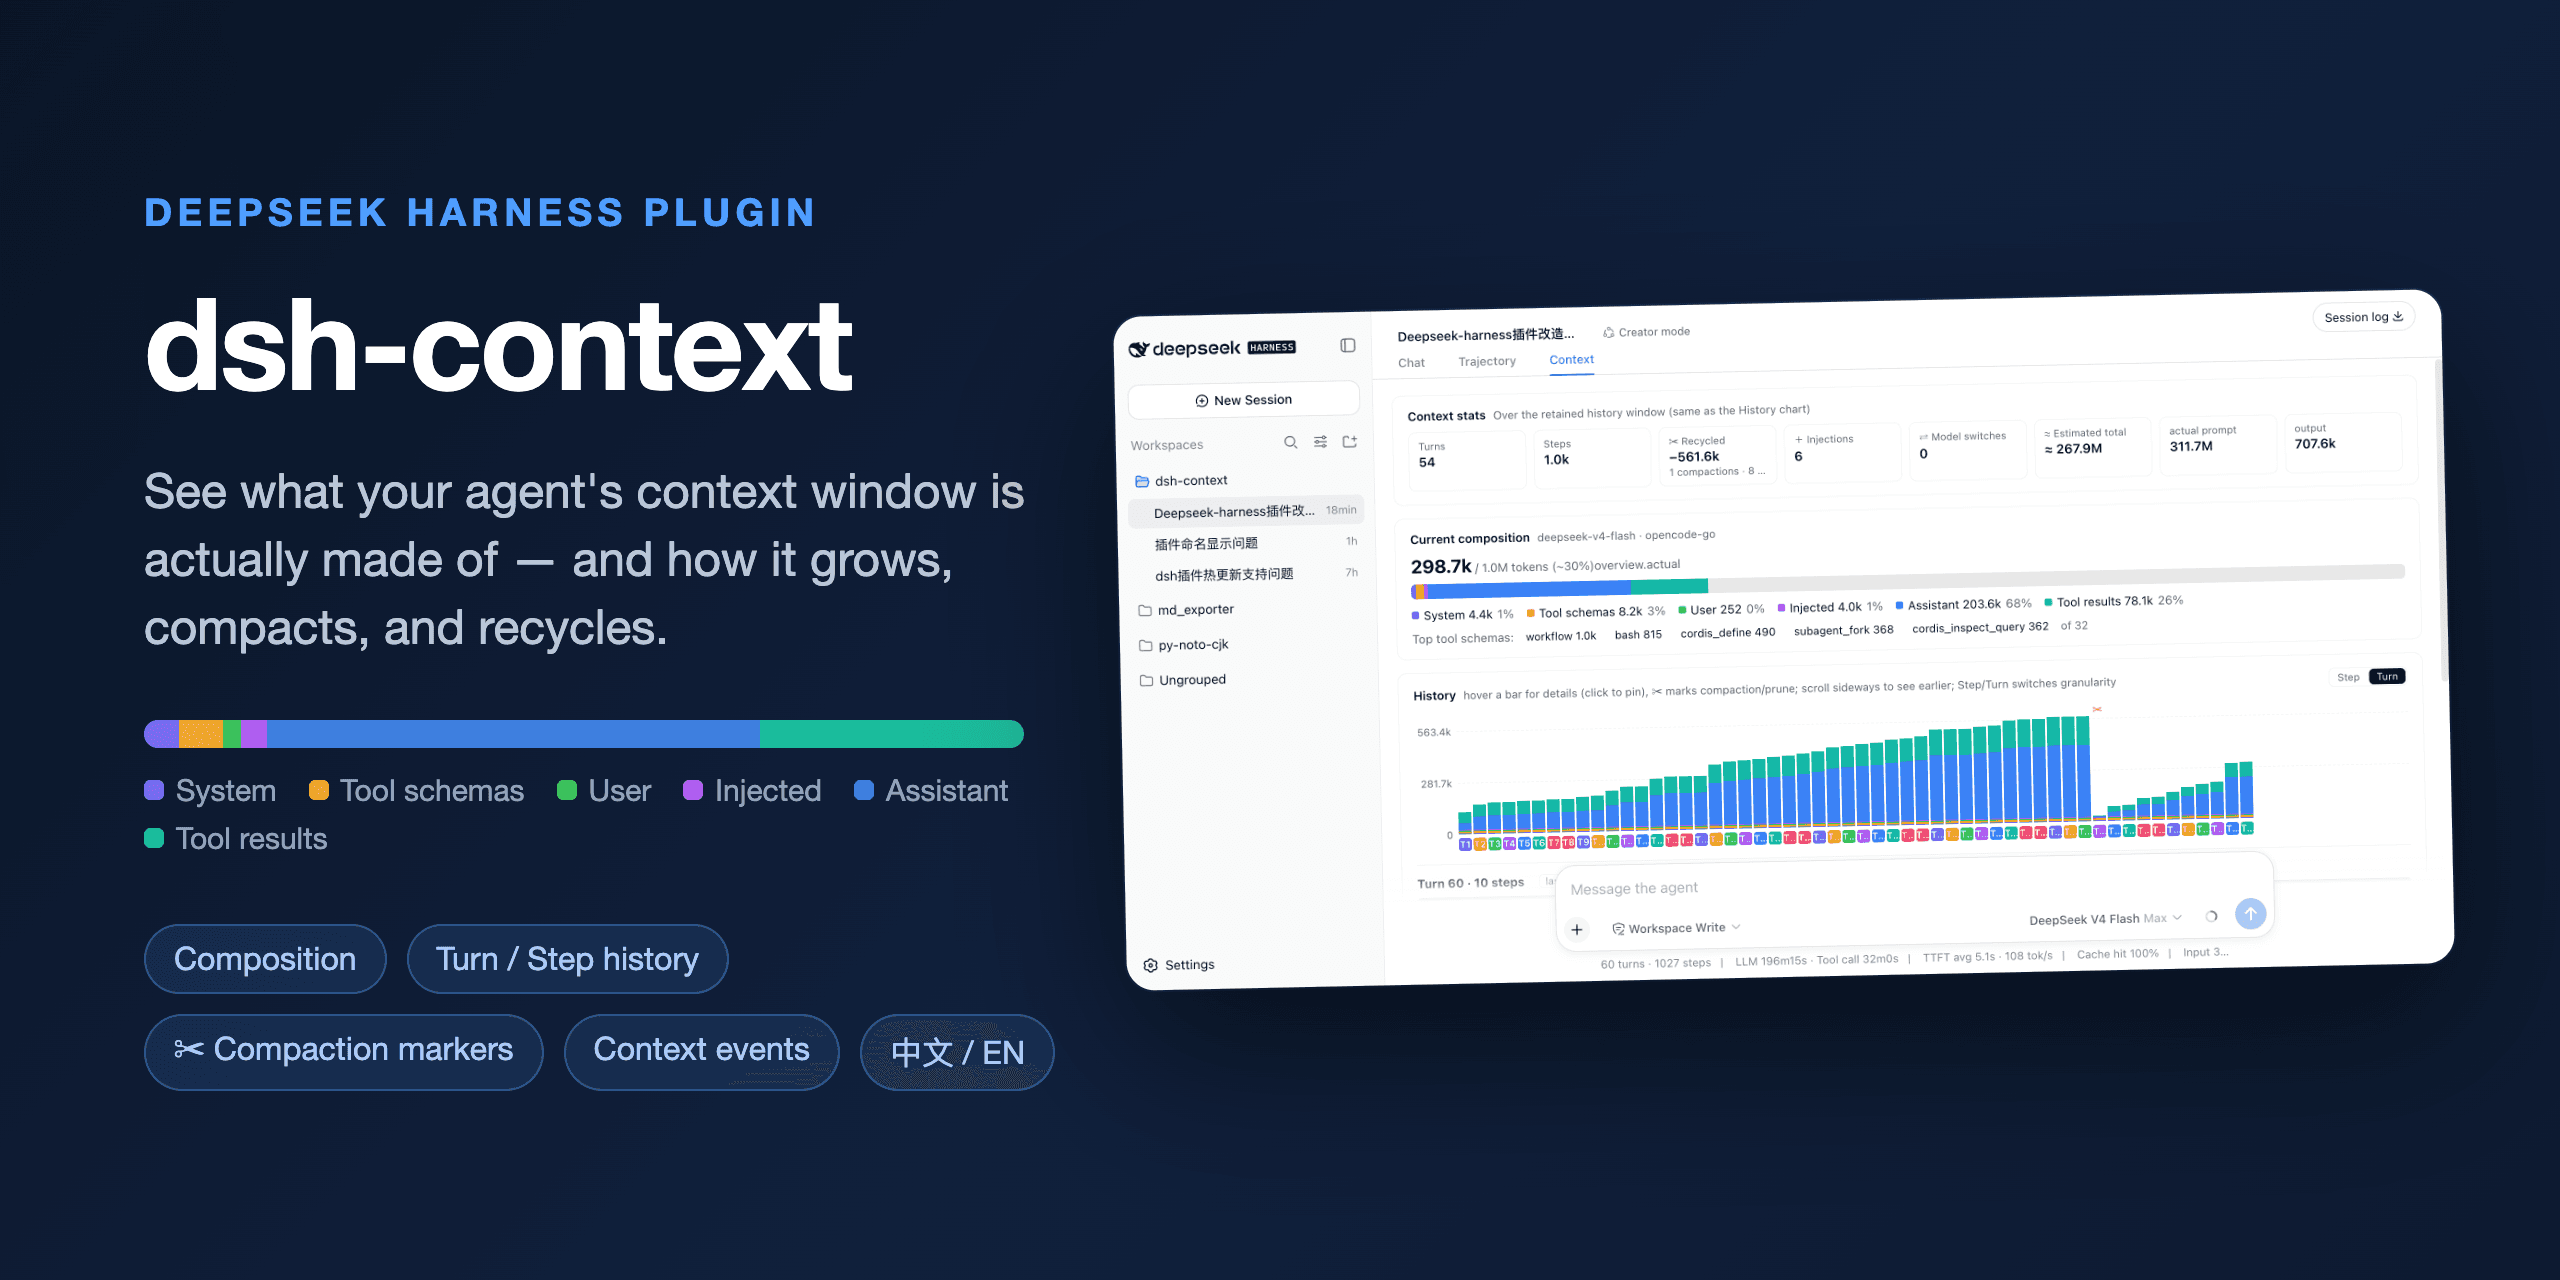
See what your DeepSeek Harness agent's context window is actually made of and how it evolves.
dsh-context is a DeepSeek Harness plugin that adds a Context Insight panel to the web UI: a live, visual answer to "what is the model carrying right now, and how did it get there?" — context composition, per-request history, compactions, and injections, all in one place.
Install
One command, from any DeepSeek Harness installation:
dsh plugin --profile web add dsh-context
Then start the web UI with dsh web, open any session, and click the 上下文 / Context tab. No build step, no restart.
What you'll see
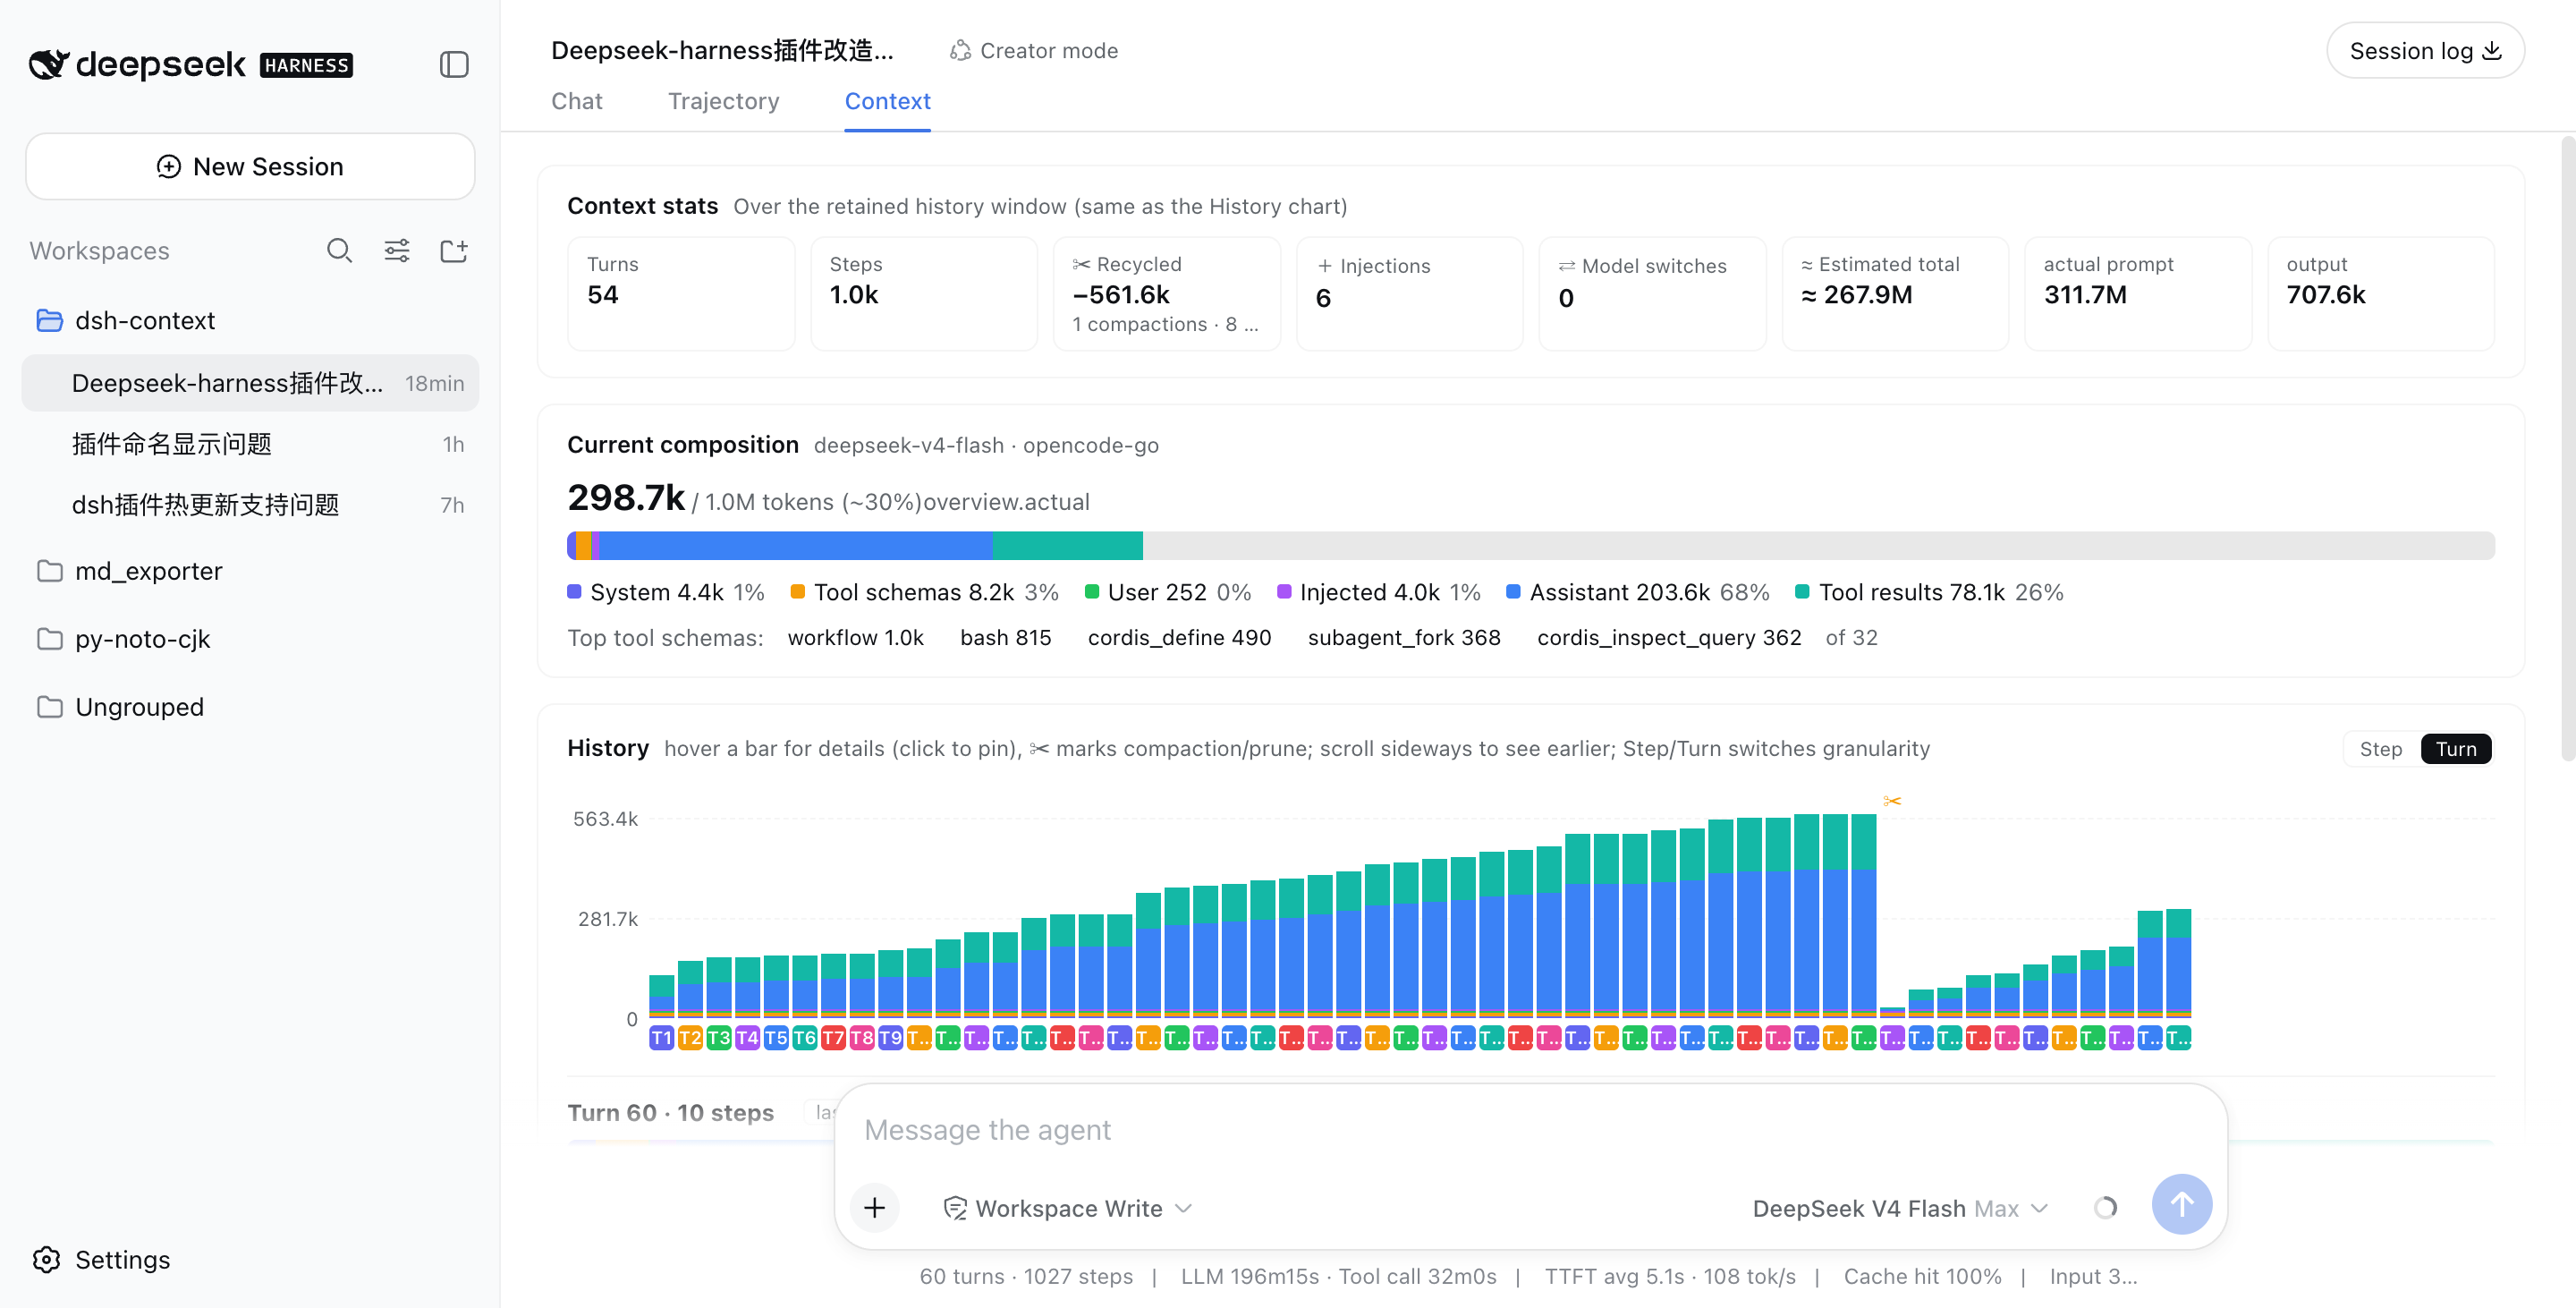
📊 Context stats — the session at a glance
Turns, steps, how much context has been recycled by compactions and prunes, how many injections happened, model switches, and the estimated total tokens sent — next to the provider-reported actuals, so you can see how the estimate holds up.
🧱 Current composition — what's in the window right now
A six-color stacked bar scaled against the model's full context window (the gray track is your remaining headroom): system prompt, tool schemas, your messages, injected context, assistant replies, and tool results — plus the top-5 most expensive tool schemas. When a conversation starts degrading, this is where you find out which part ate the budget.
📈 History — watch the window grow (and get compacted)
One stacked bar per model request, finer than per-message. Toggle between Turn and Step granularity, scroll sideways through the session, hover any bar for a quick tooltip, and click to pin the full breakdown — including provider-reported actual prompt/output tokens next to the estimate. ✂ marks where compaction or pruning happened — watch the bars drop:
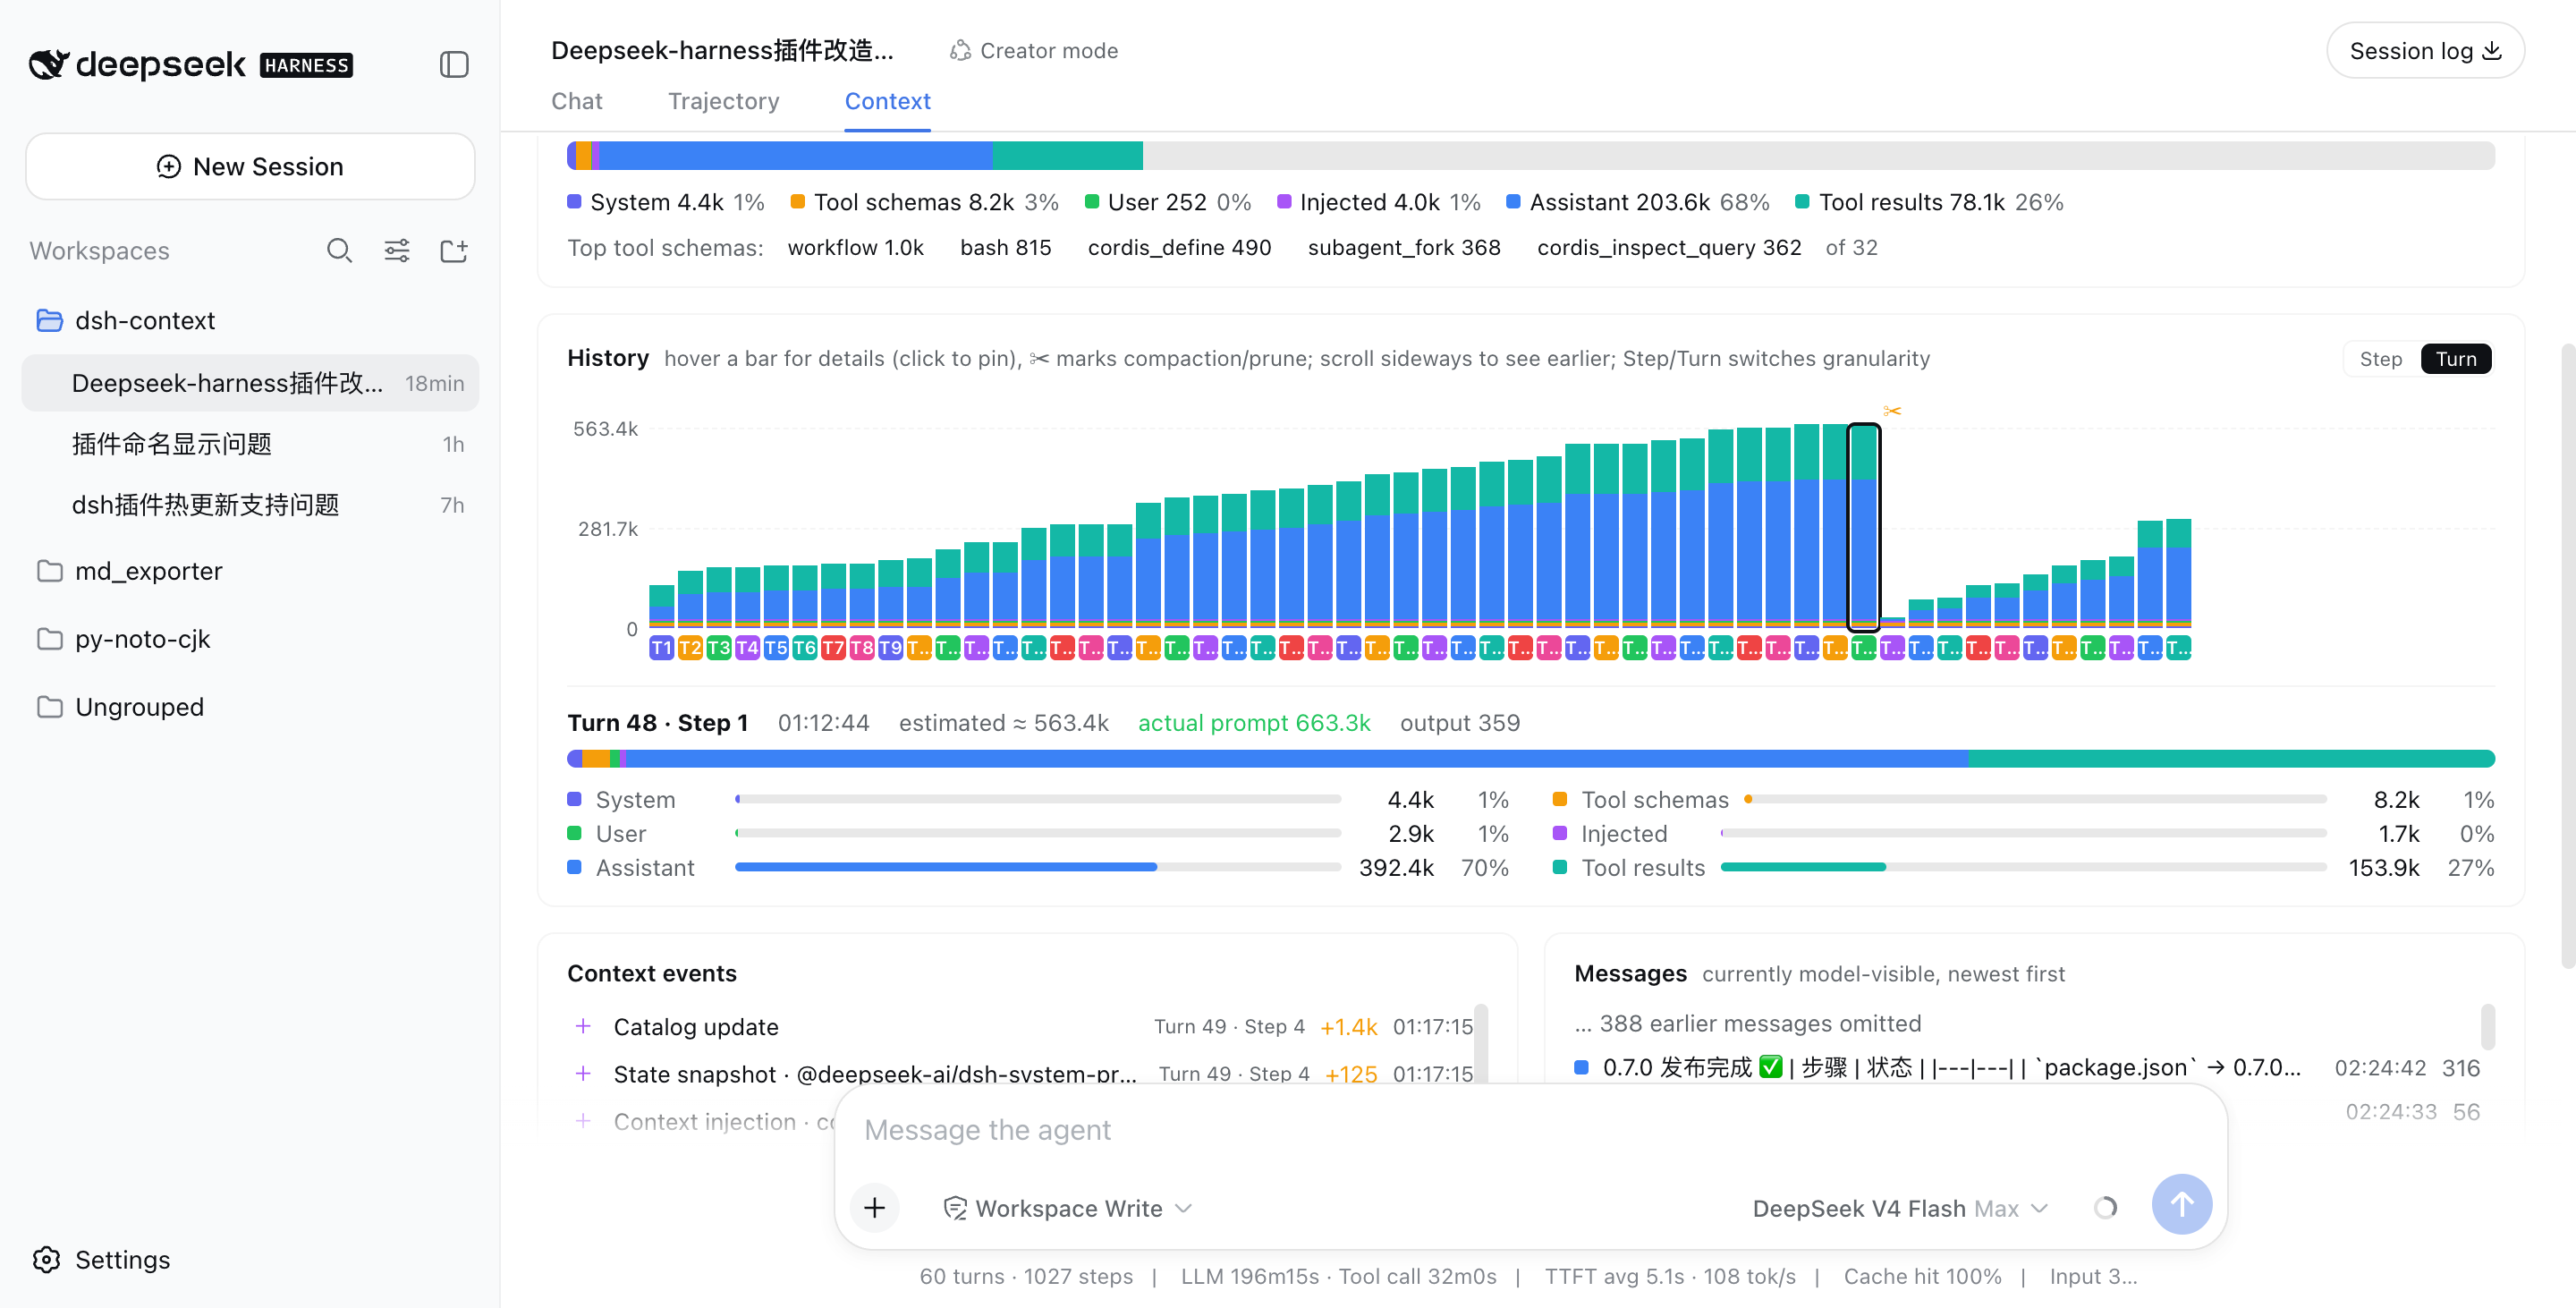
Above: a real session that grew to ~563k tokens across 48 turns, then compaction (✂) recycled −535.5k in one step, and the conversation continued from a fresh, small window.
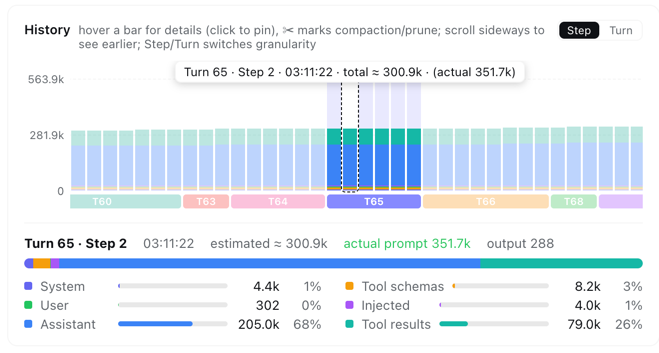
In Step granularity, hovering any bar shows that single step's context info instantly — its turn/step, timestamp, and estimated vs. provider-reported token counts:
⚡ Context events — when and why the window changed
Every compaction, tool-output prune, skill or plugin context injection, and model switch — each with its token delta, turn/step attribution, and timestamp:
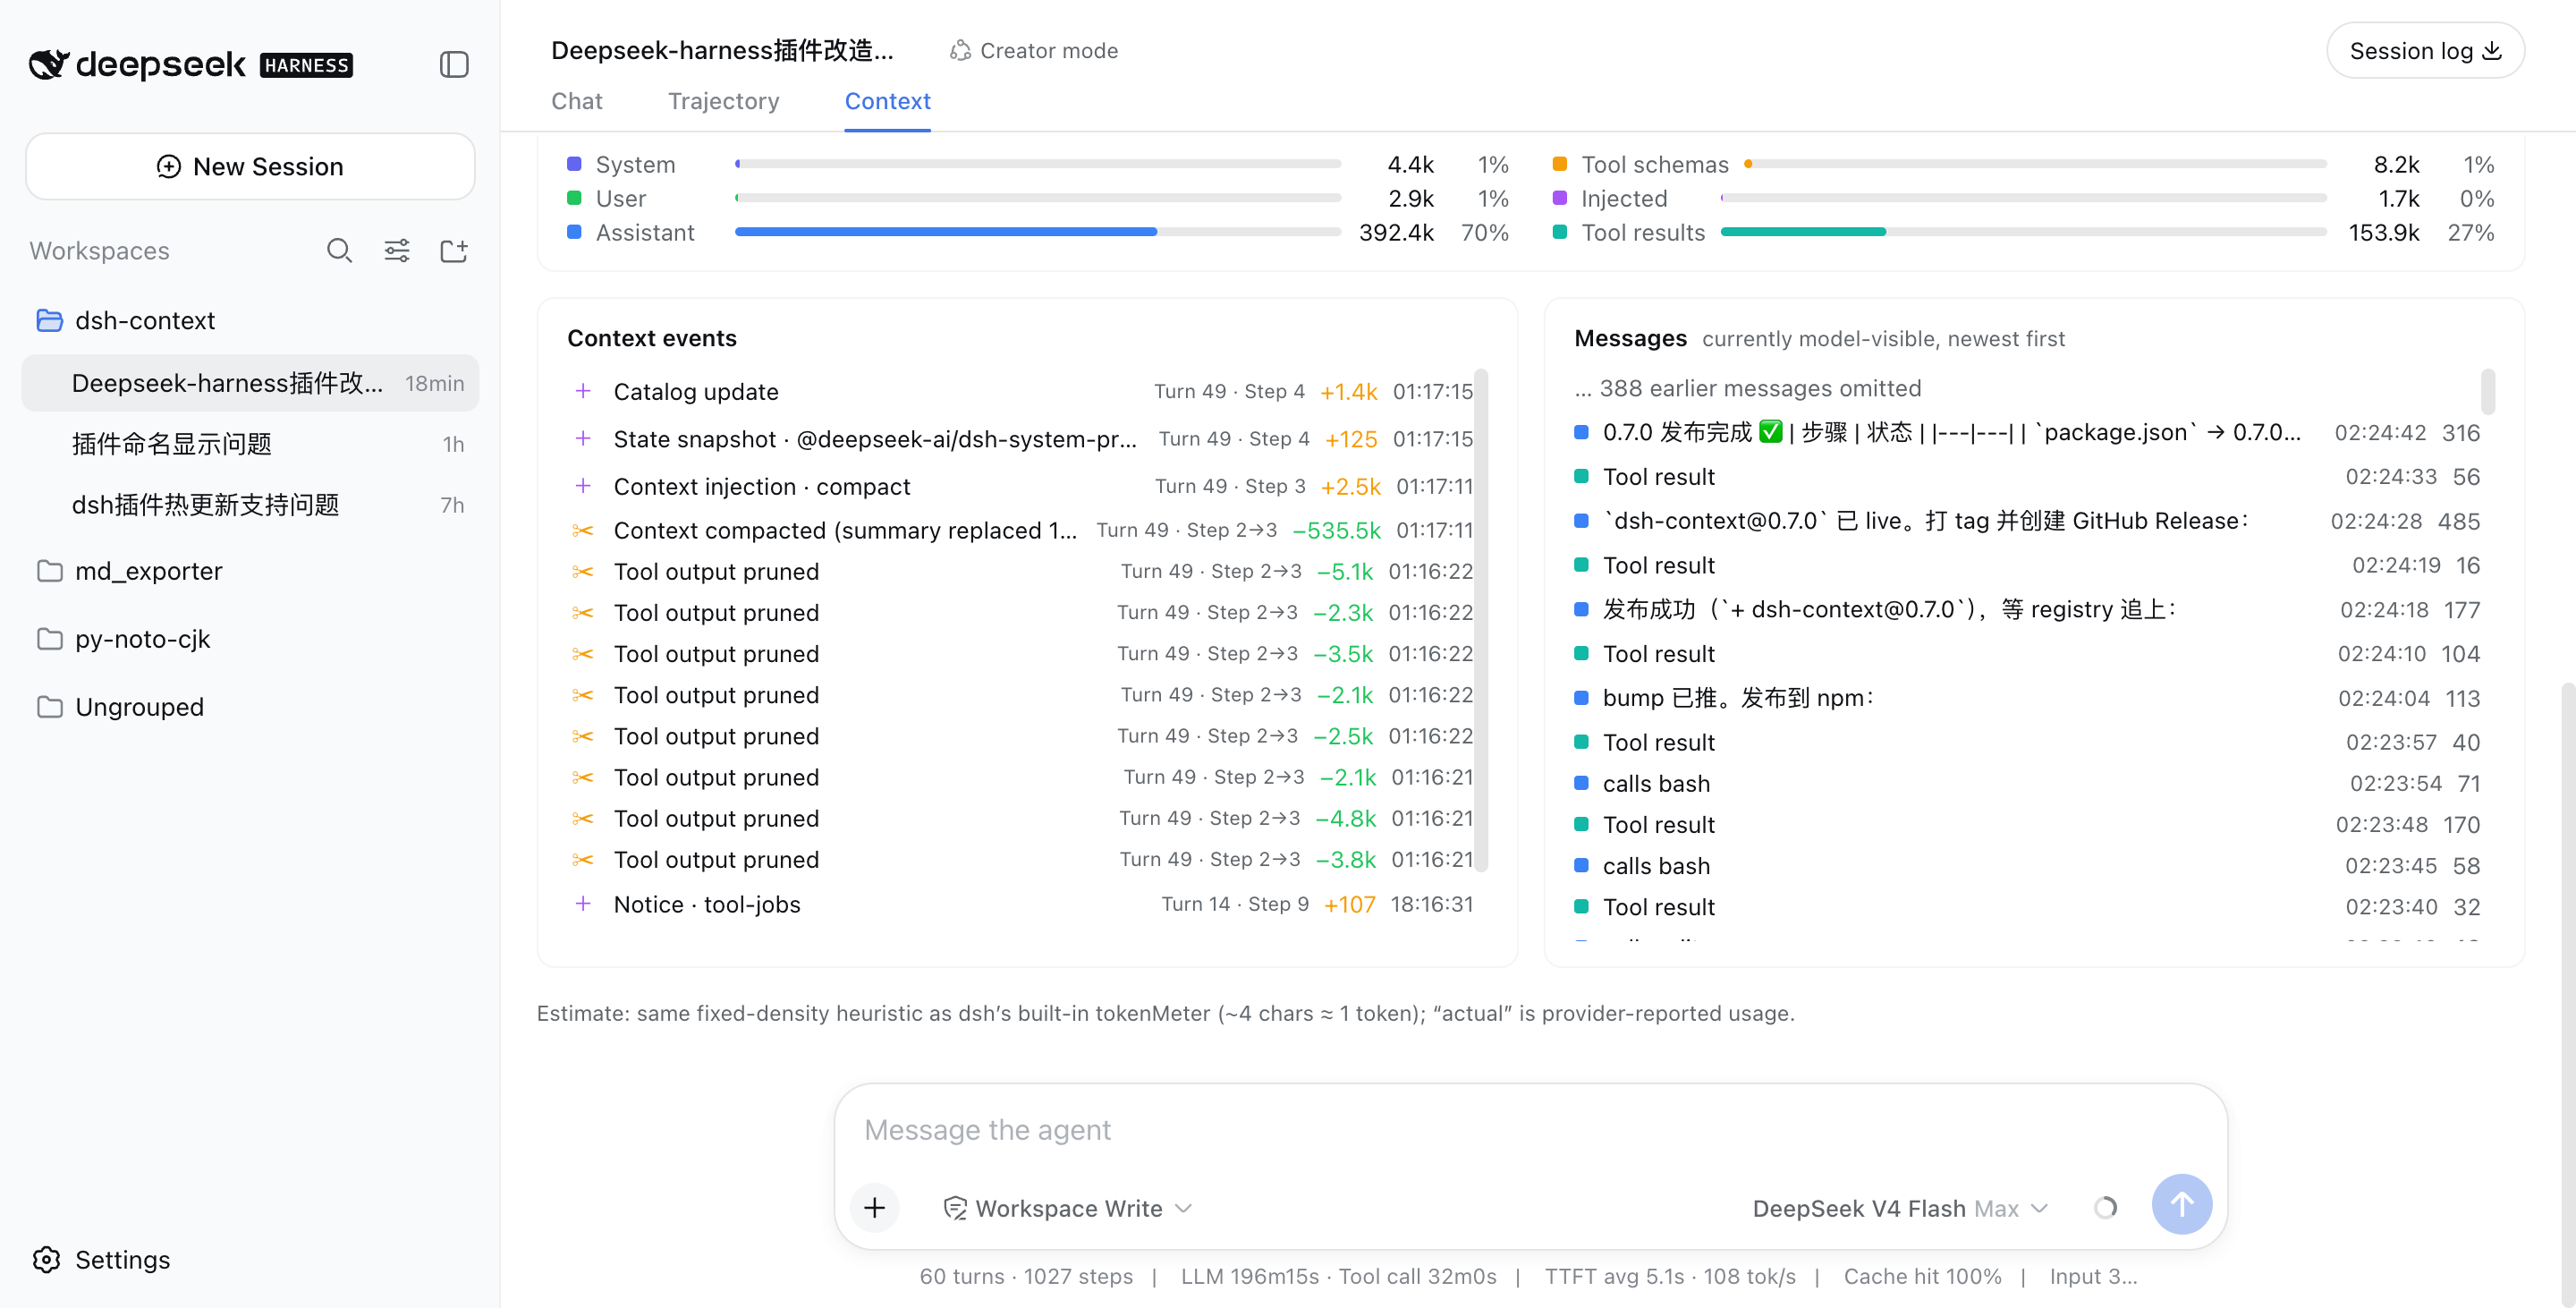
💬 Messages — the currently model-visible surface
The exact message list the model sees right now, newest first, with a per-message token cost.
Releasing
Releases are cut by tagging: git tag vX.Y.Z && gh release create vX.Y.Z. A GitHub Actions workflow then builds, tests, and publishes the package to npm automatically via npm Trusted Publishing (OIDC) — no long-lived token needed, provenance included.
Like it?
If dsh-context helped you understand what your agent is carrying around, a ⭐ on GitHub is much appreciated — and issues/PRs are welcome!