 bowenliang123
d29dcf89fa
token-meter is a core service that owns estimation and replay (its docs:
'the singleton ctx.tokenMeter directly owns estimation and replay'), and the
published package registers three projections on the shared
SessionProjectionMap — tokenUsage / contextPressure / contextBreakdown.
The host was duplicating the contextPressure fold (pressureTokens +
sampledSurfaceTokens + occupancyWindow, sampleUsage on assistant/message and
usage chunks) and the client was rendering from that mirror.

Host: the occupancy mirror leaves the fold entirely (assistant/chunk is now
structurally ignored — same reference, no change feed). stateVersion 1 -> 2
so cached rows from the old fold are discarded. The strict wire schema no
longer accepts occupancy; the shared type keeps it optional as legacy for
downstream consumers.

Client: the headline reads the official token-meter contextPressure
projection via the useProjection seat (the same key the chat's context ring
reads); absent key/value degrades to the existing derived fallback (last
request prompt + surface movement), so the UI renders identically in every
deployment. UI functionality is unchanged — same headline, same percentages,
same composition anchoring.

diff-fold.mjs is repurposed: the plugin no longer has an occupancy fold to
compare, but its heuristic composition (current.system/tools + surface total)
must stay equal to the official contextBreakdown projection — verified
MATCH on three real session logs.

Tests: host asserts occupancy is absent + chunk reference stability; client
feeds the official projection through the stub and asserts the same UI text.
dsh-context


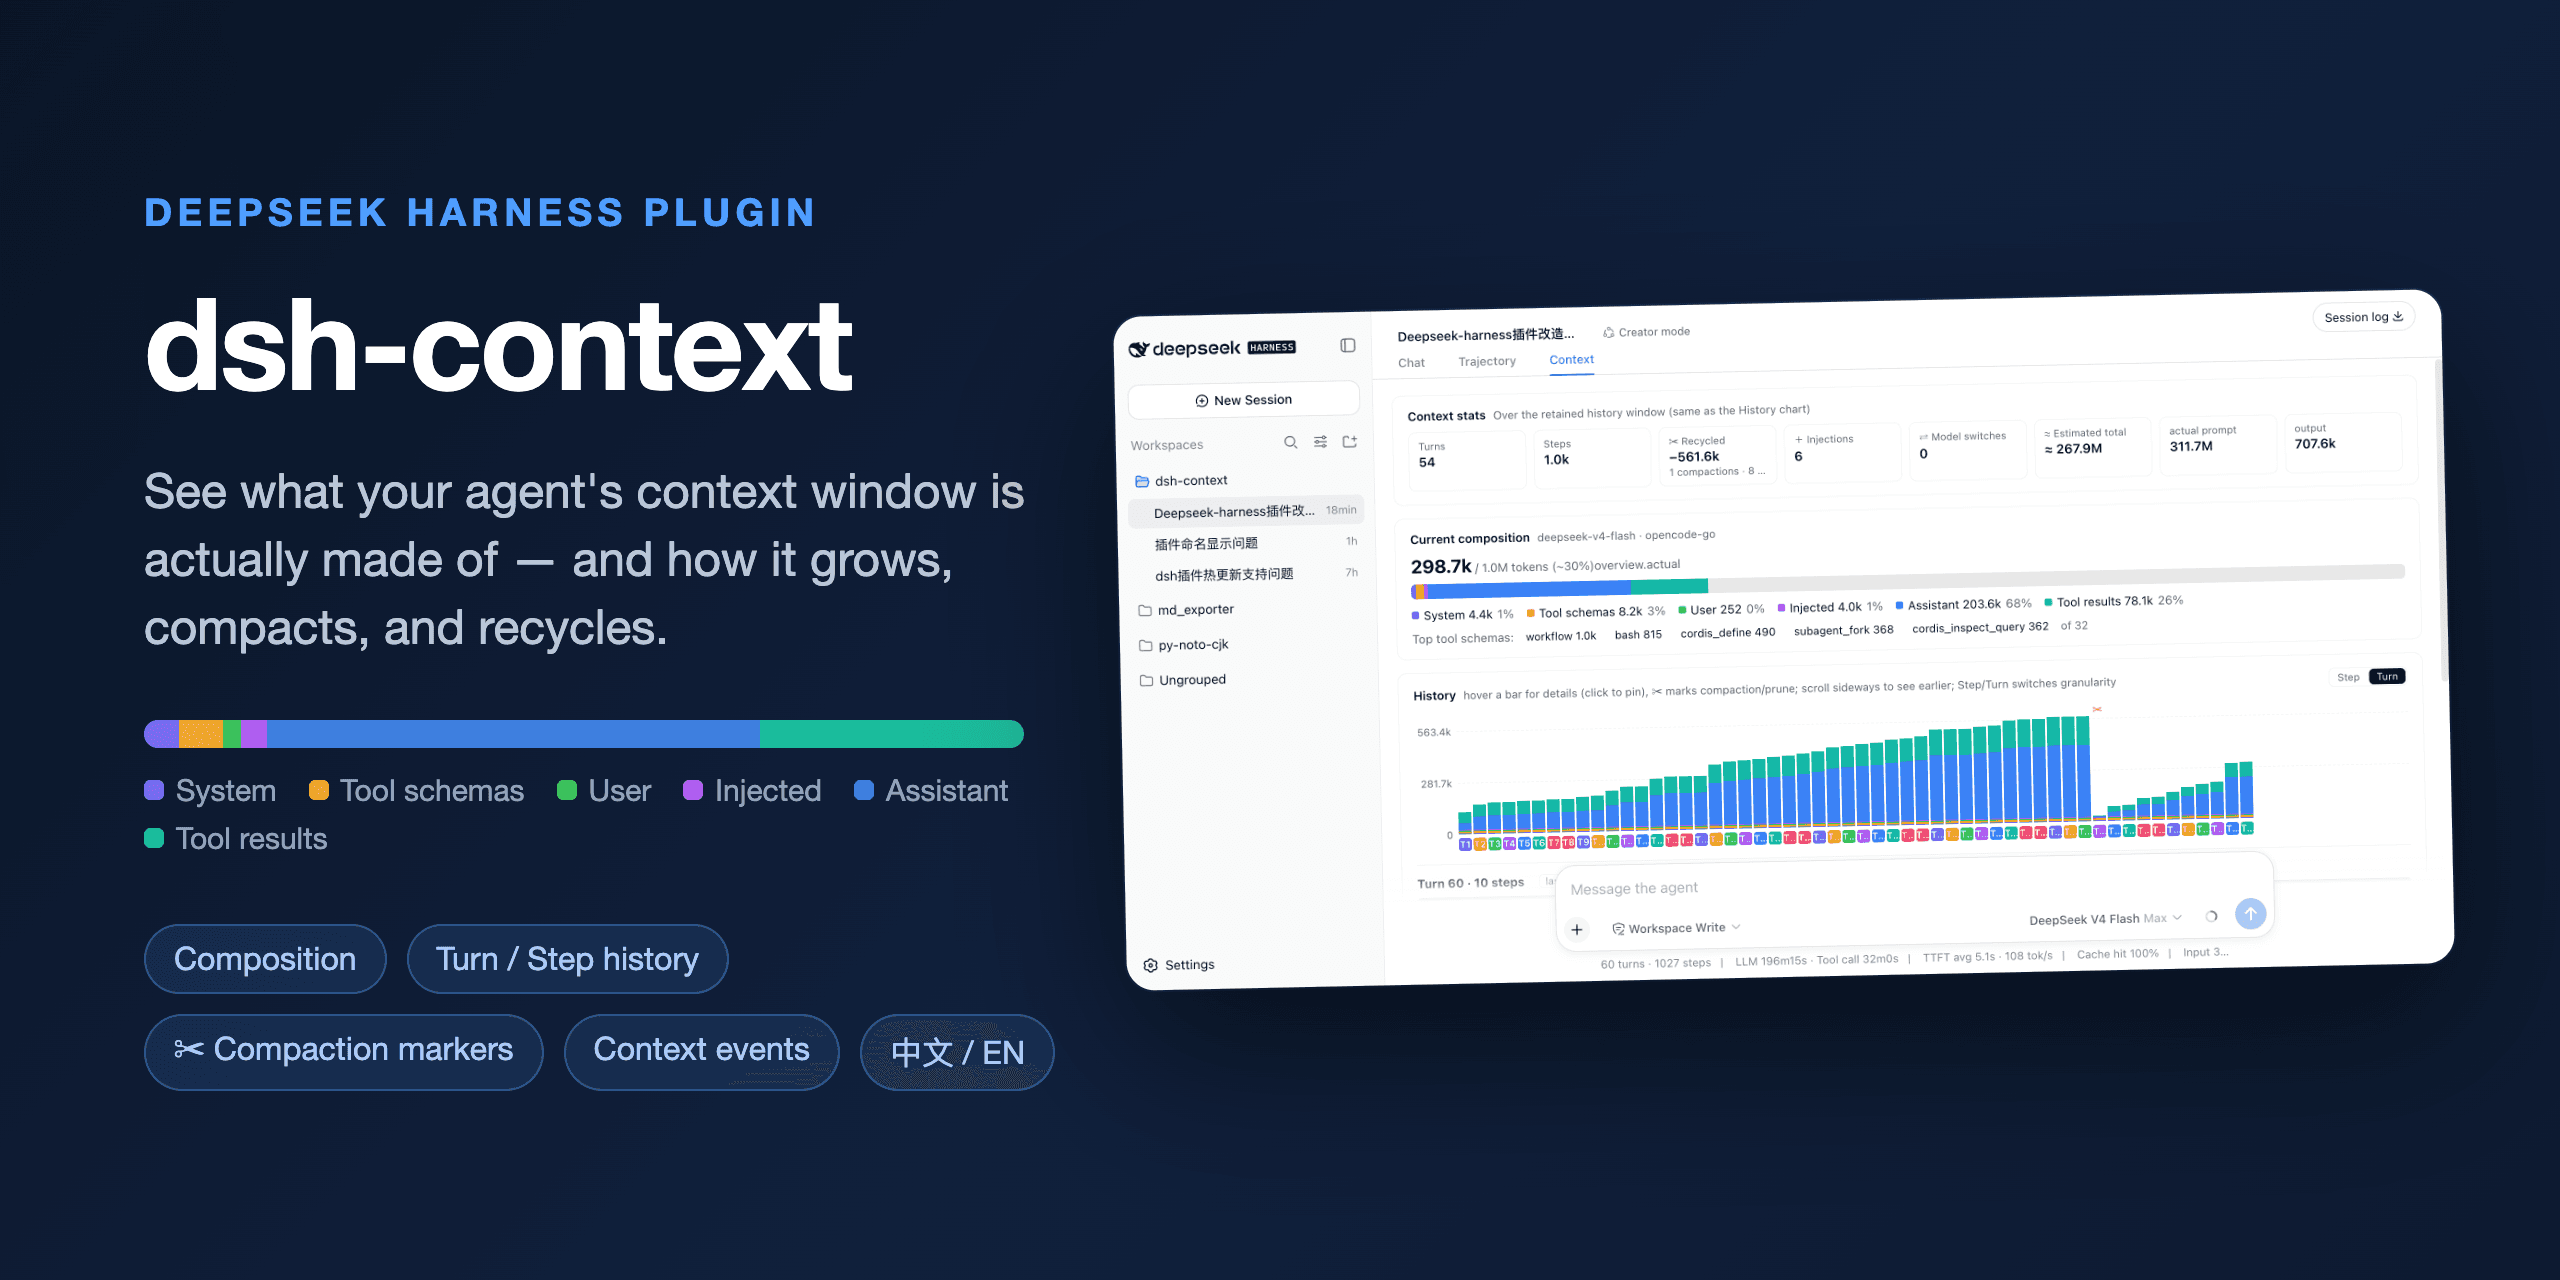
A DeepSeek Harness plugin for context dashboard and context command, for understanding how the context is made of, and how it evolves.
dsh-context is a DeepSeek Harness plugin for context insight.
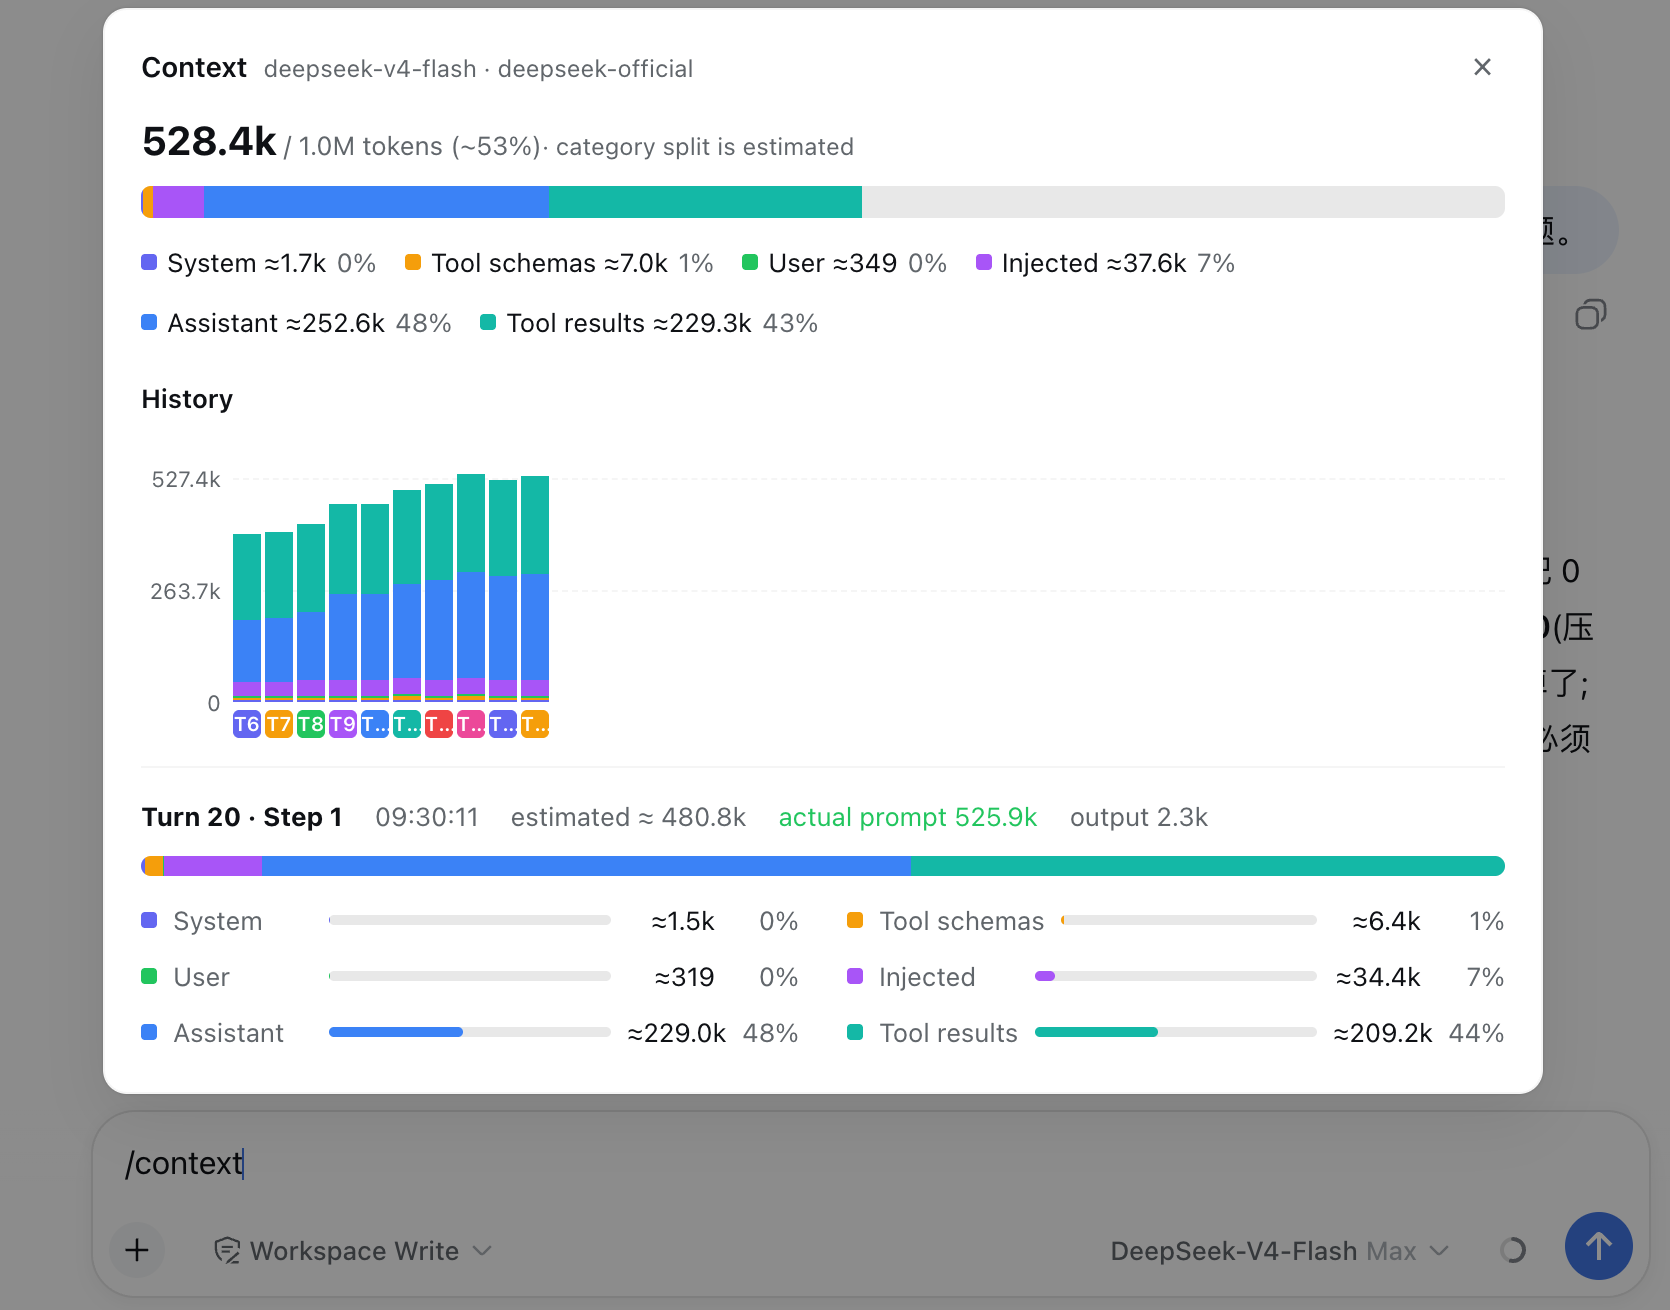
- The Context tab — a full insight panel for context composition, per-turn context history, context compactions, and the message surface, etc.
- The
/contextcommand — the same headline and recent trend as a centered dialog straight from the composer (the screenshot above).
Install
One command, from any DeepSeek Harness installation:
dsh plugin --profile web add dsh-context
Then start the web UI with dsh web. No build step, no restart.
Use it
Context tab
Open any session and click the Context / 上下文 tab:
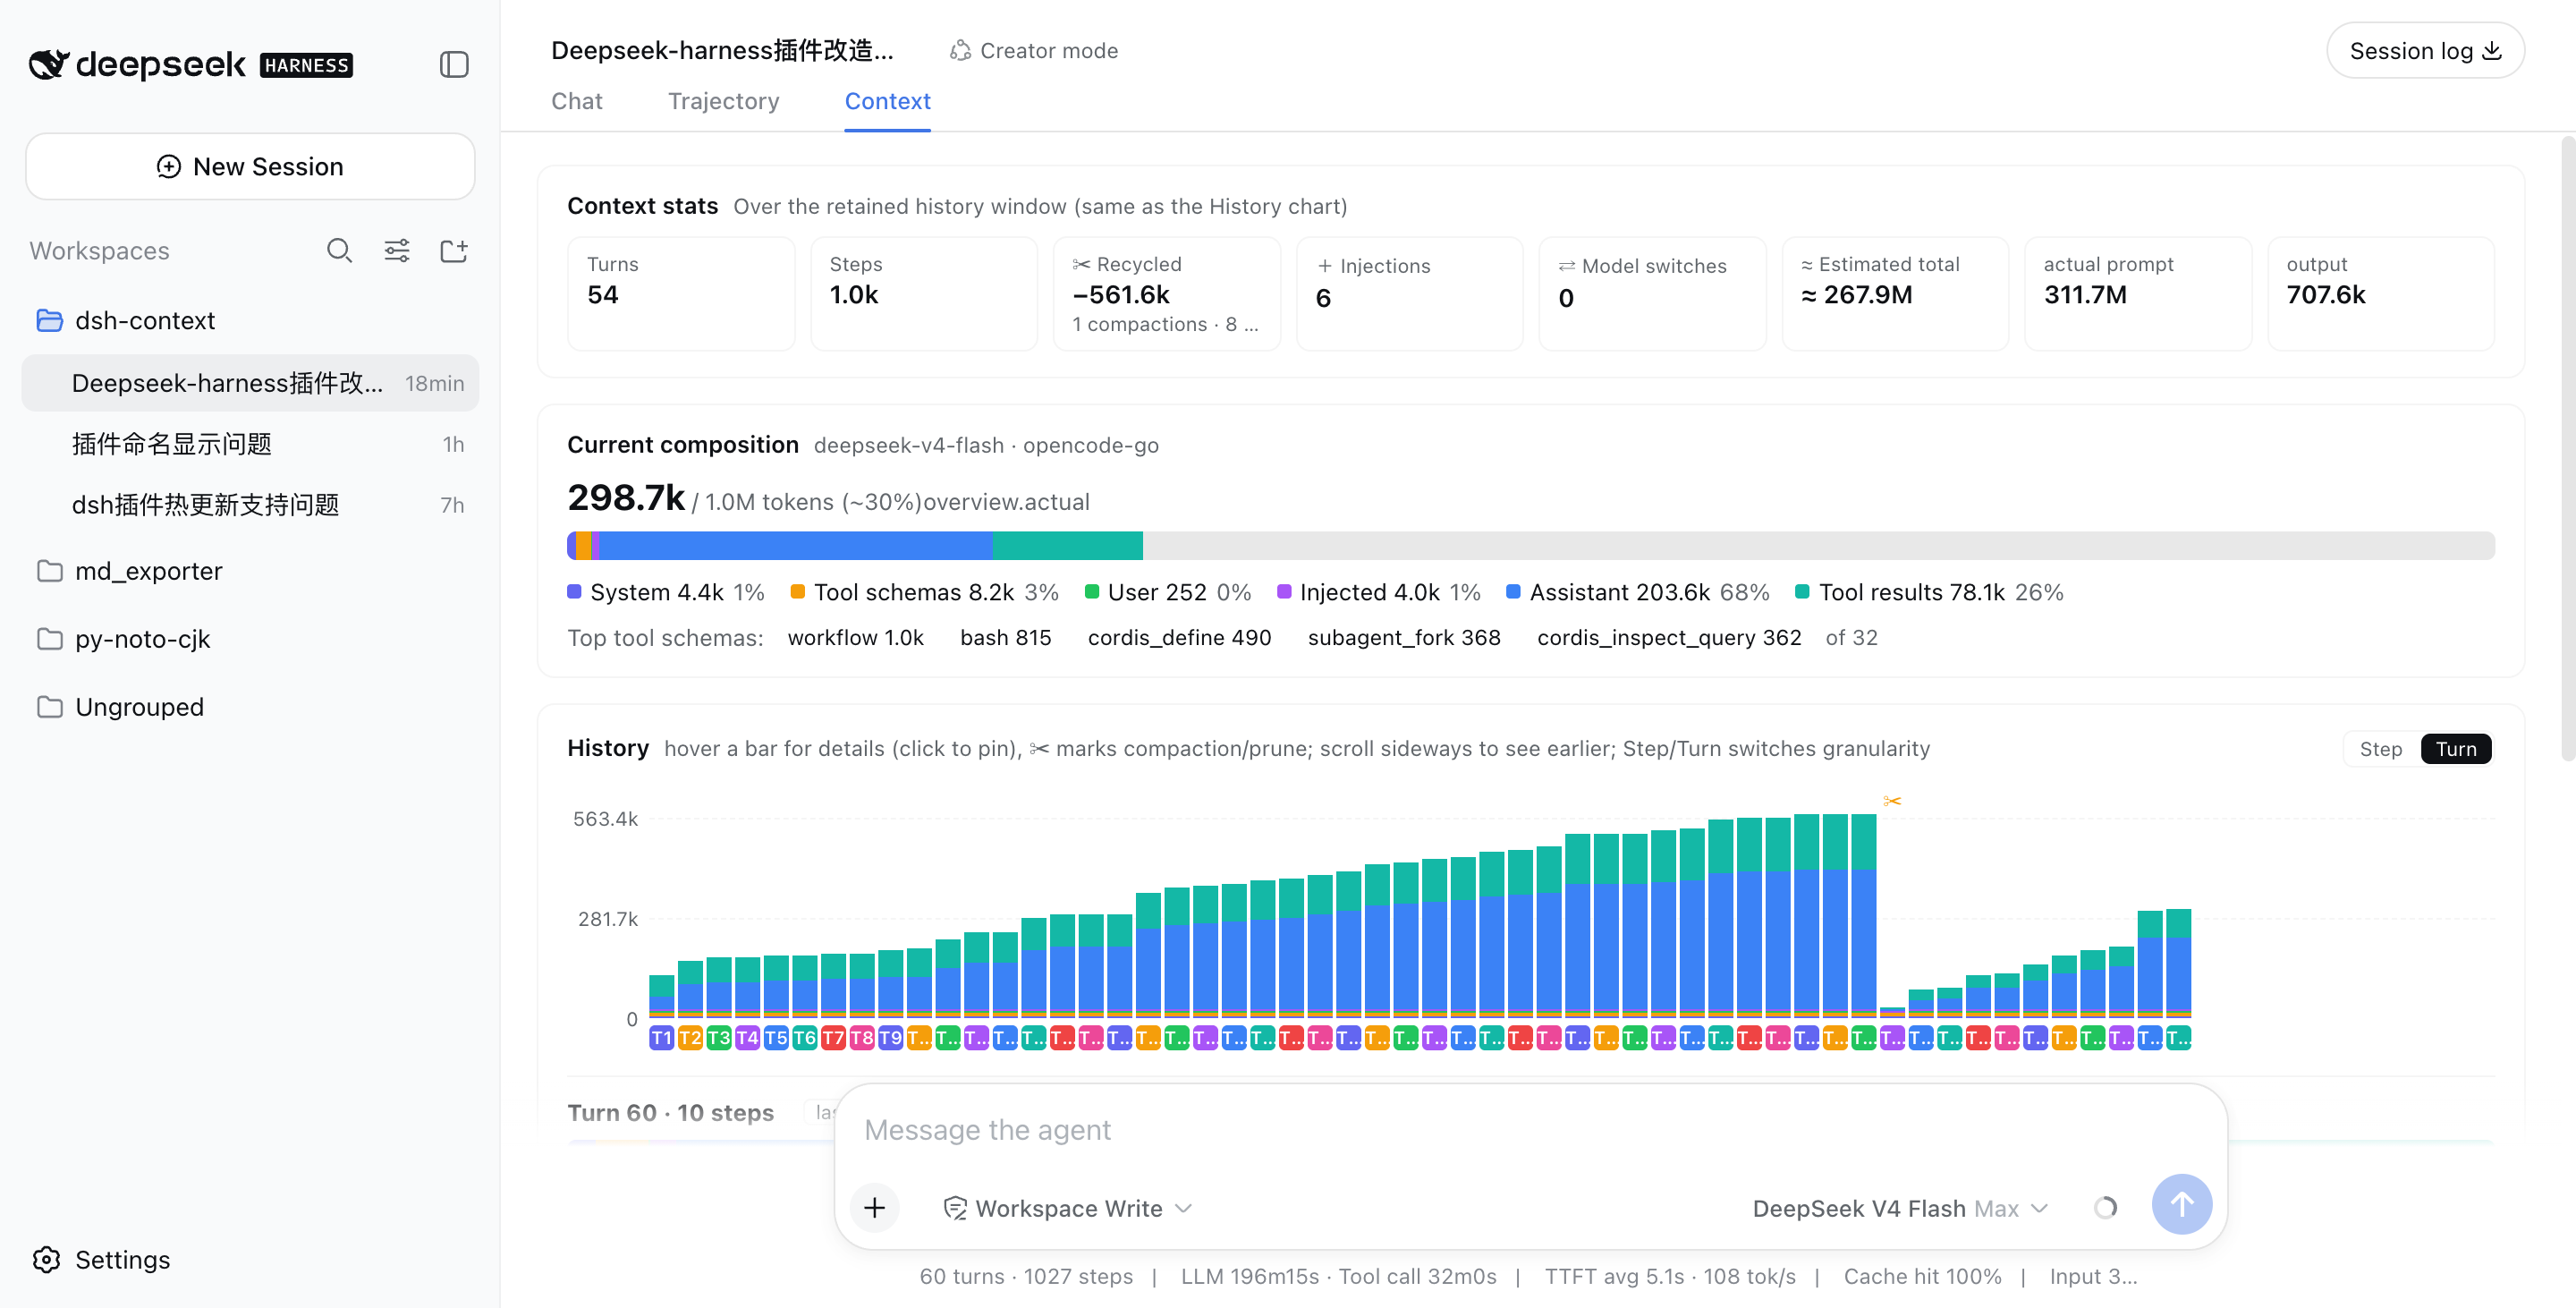
⌨️ /context command — In-session Context Insight modal
Type /context (or pick it from the / menu) and press Enter: a centered dialog shows the provider-anchored occupancy headline, the six-category composition bar, and the last-10-turn trend chart — hover or click a bar for its full breakdown, exactly like the tab.
What you'll see
📊 Context stats — the session at a glance
Turns, steps, how much context has been recycled by compactions and prunes, how many injections happened, model switches, and the estimated total tokens sent — next to the provider-reported actuals, so you can see how the estimate holds up.
🧱 Current composition — what's in the window right now
A six-color stacked bar scaled against the model's full context window (the gray track is your remaining headroom): system prompt, tool schemas, your messages, injected context, assistant replies, and tool results — plus the top-5 most expensive tool schemas. When a conversation starts degrading, this is where you find out which part ate the budget.
📈 History — watch the window grow (and get compacted)
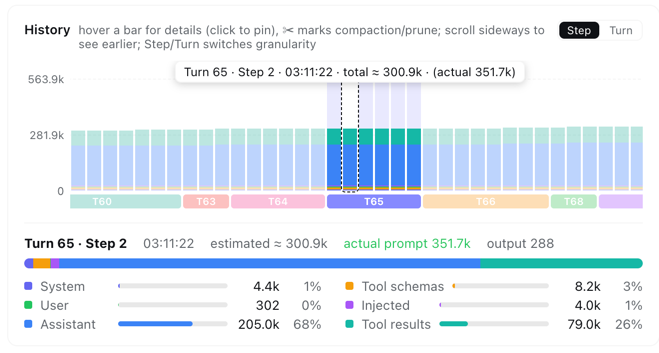
One stacked bar per model request, finer than per-message. Toggle between Turn and Step granularity, scroll sideways through the session, hover any bar for a quick tooltip, and click to pin the full breakdown — including provider-reported actual prompt/output tokens next to the estimate. ✂ marks where compaction or pruning happened — watch the bars drop:
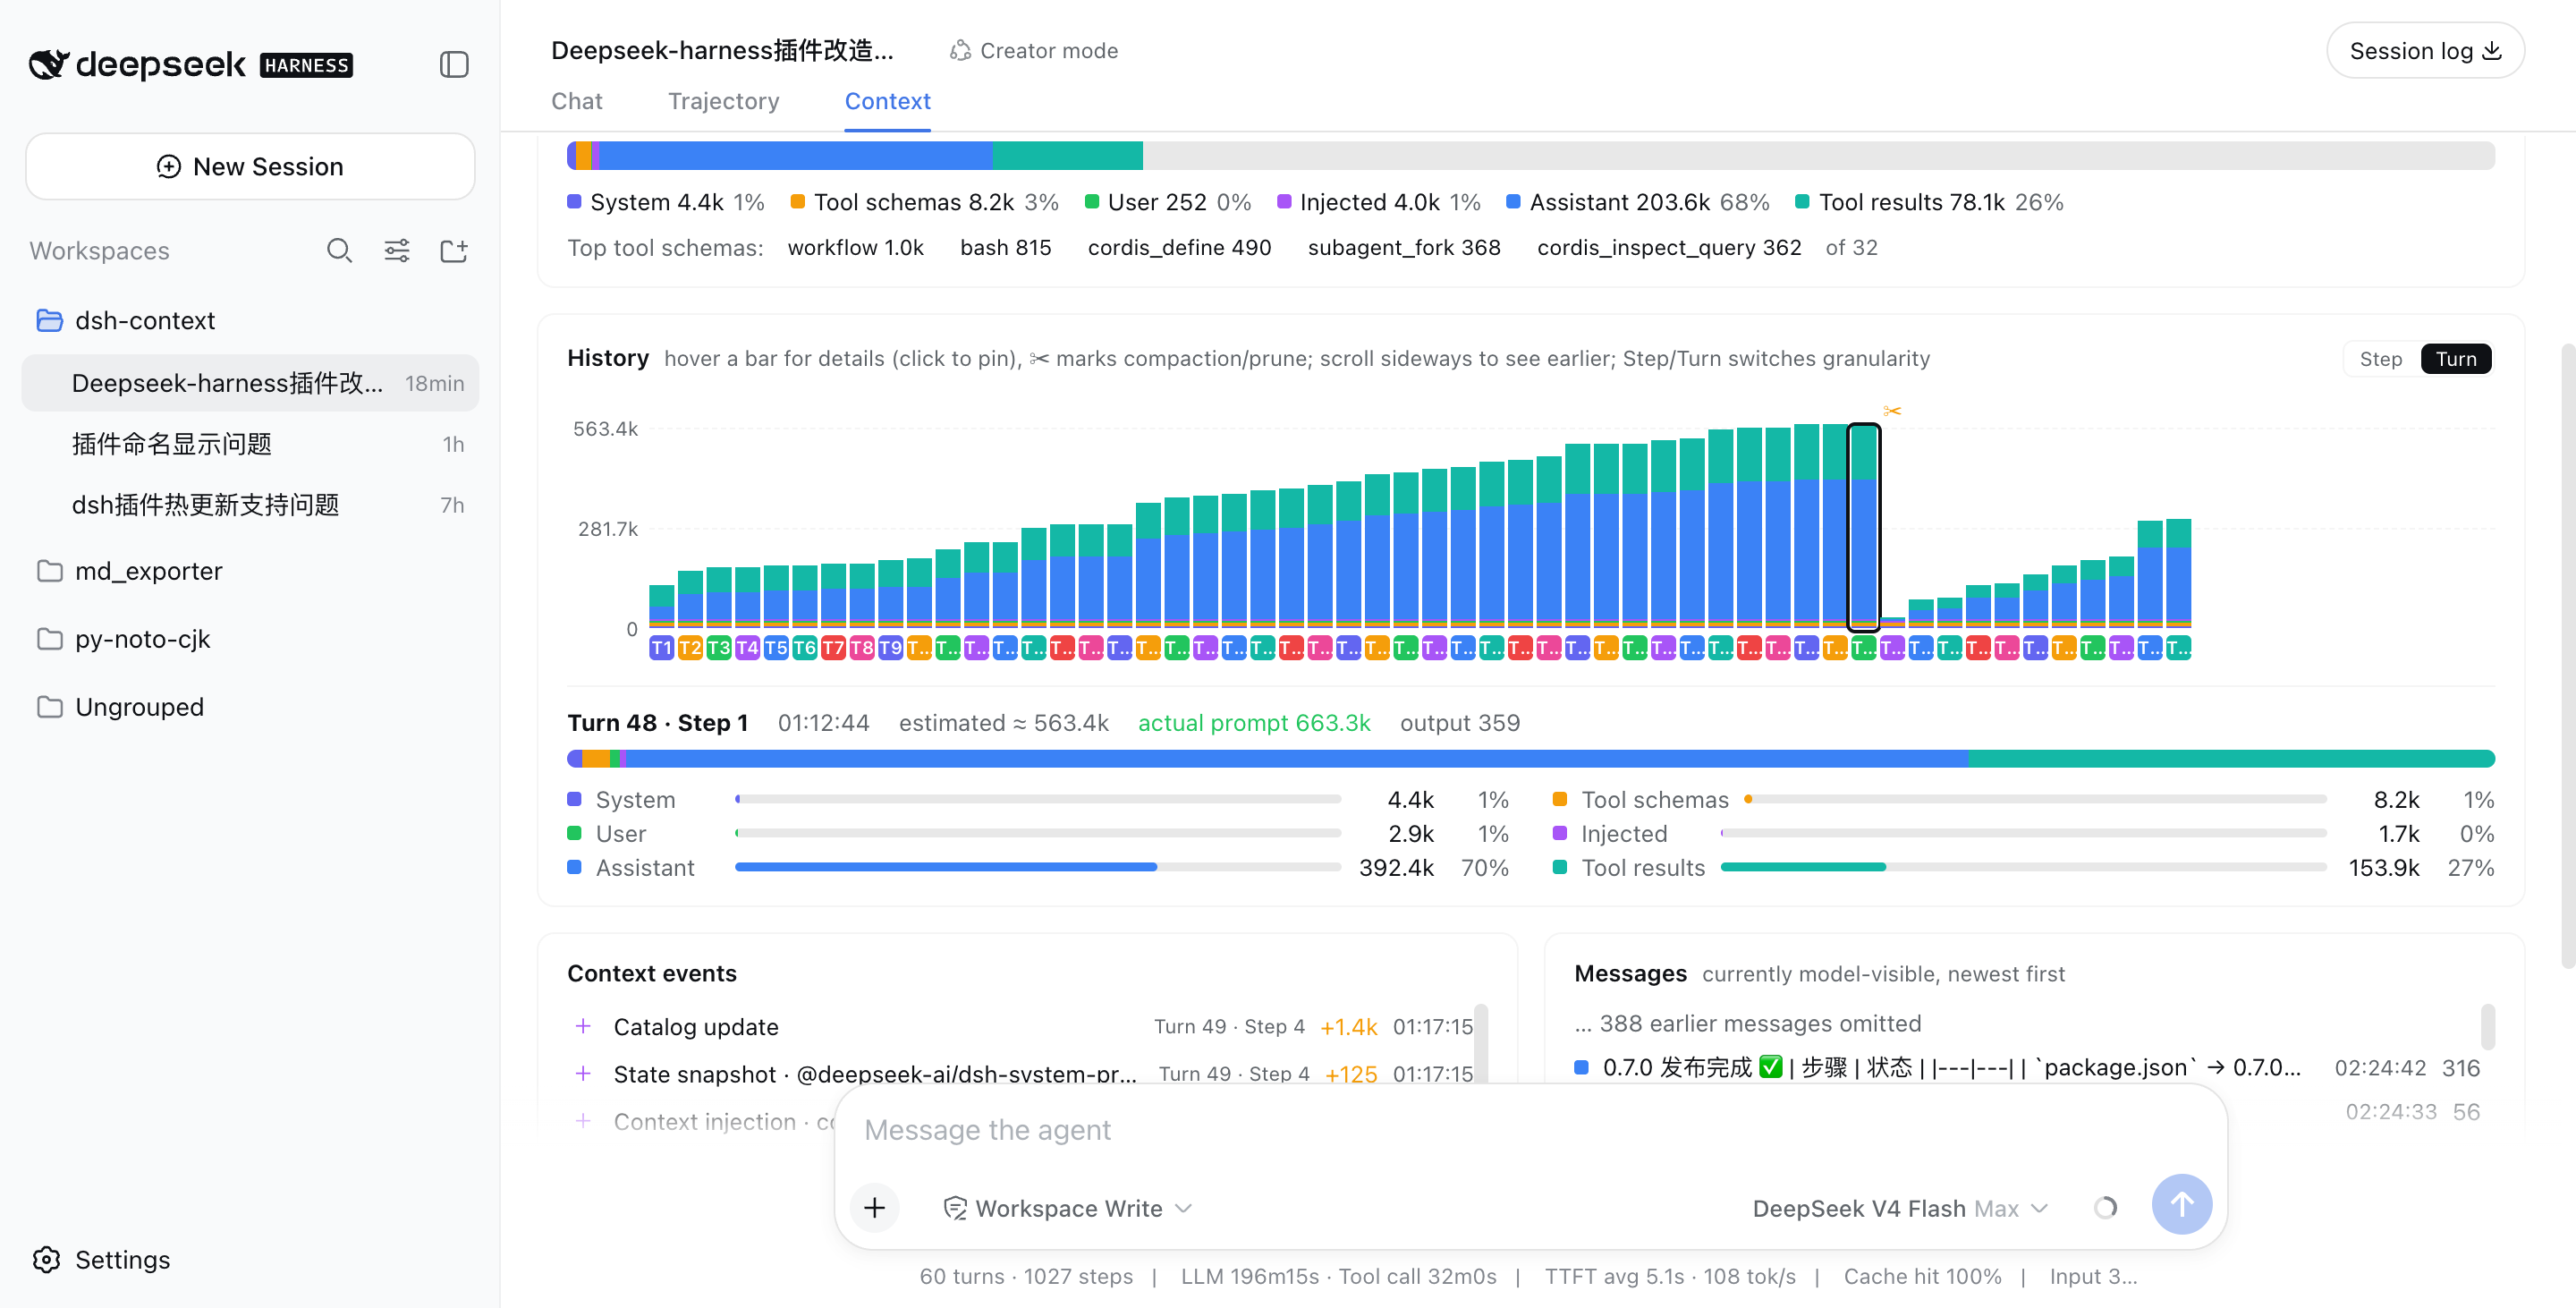
Above: a real session that grew to ~563k tokens across 48 turns, then compaction (✂) recycled −535.5k in one step, and the conversation continued from a fresh, small window.
In Step granularity, hovering any bar shows that single step's context info instantly — its turn/step, timestamp, and estimated vs. provider-reported token counts:
⚡ Context events — when and why the window changed
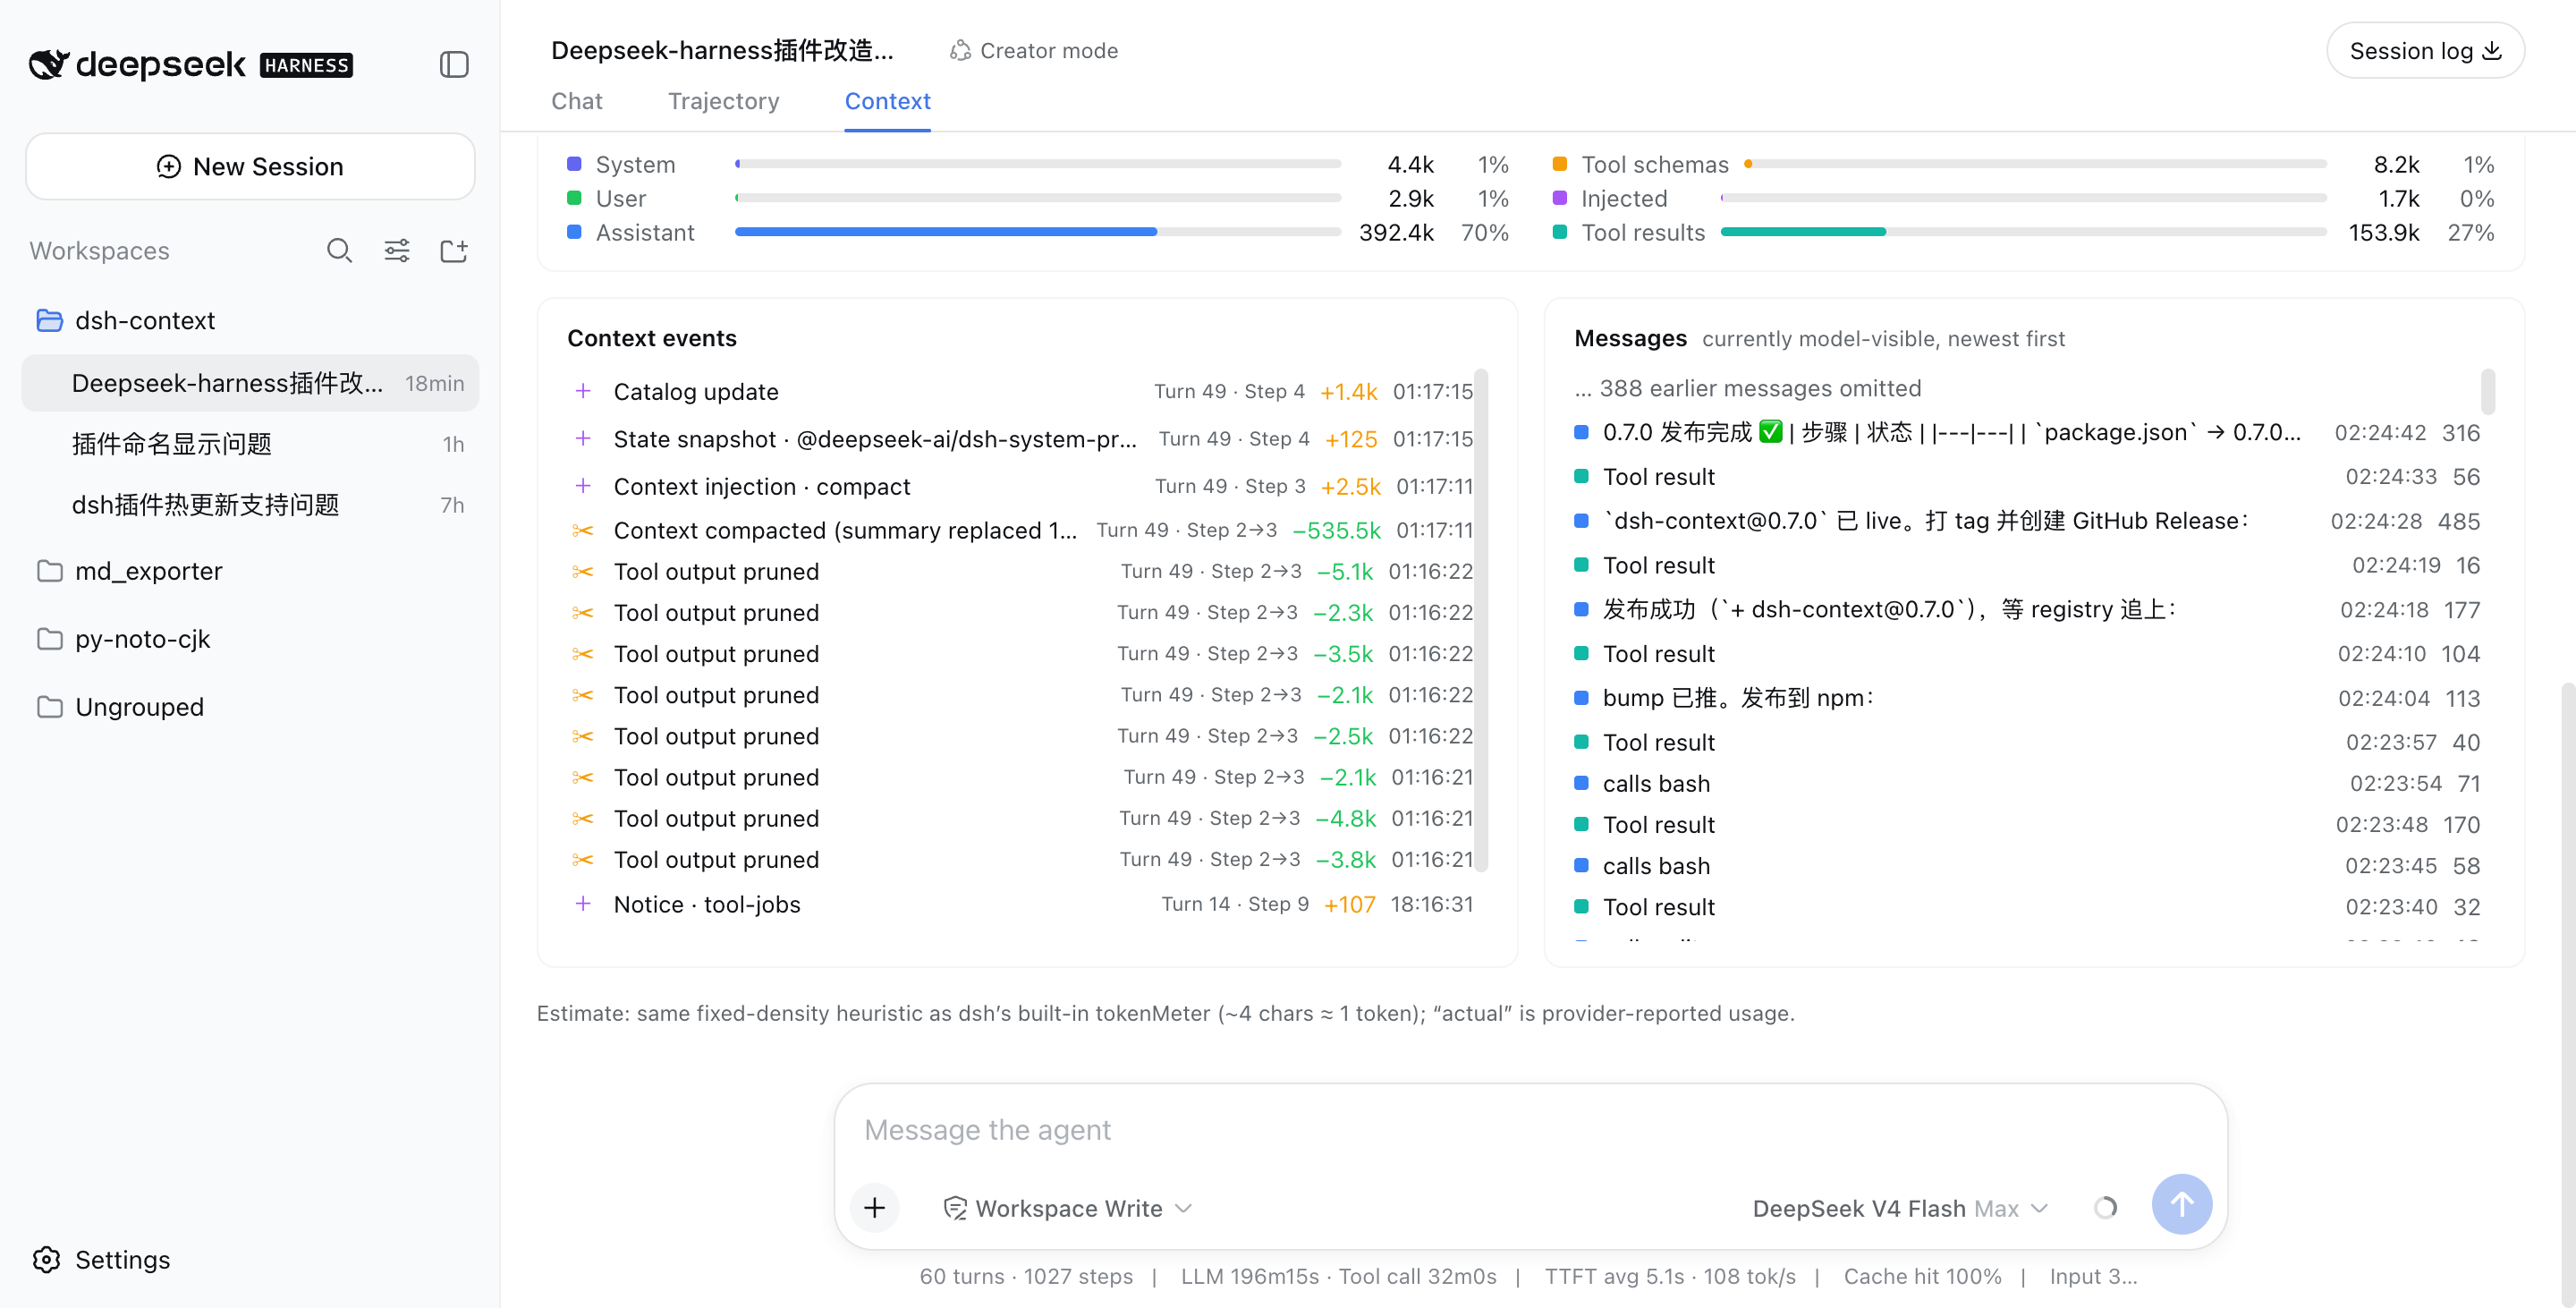
Every compaction, tool-output prune, skill or plugin context injection, and model switch — each with its token delta, turn/step attribution, and timestamp:
💬 Messages — the currently model-visible surface
The exact message list the model sees right now, newest first, with a per-message token cost.
Like it?
If dsh-context helped you understand what your agent is carrying around, a ⭐ on GitHub is much appreciated — and issues/PRs are welcome!