 Onuralp SEZER
fa98266914
- Removed specific version constraint for `supervision` package in installation command. - Updated references from `sv.BoundingBoxAnnotator` to `sv.BoxAnnotator` for consistency with the latest library changes. - Removed asset extension of package installation because it is has been included into main package Signed-off-by: Onuralp SEZER <thunderbirdtr@gmail.com>
7.3 MiB
Vendored
7.3 MiB
Vendored
How To Analyze Occupancy with Supervision


In this notebook, we'll use a parking lot to demonstrate how we can extract numerous informative metrics and detailed graphics, all from one video, using Supervision.
This notebook accompanies the Occupancy Analytics with Computer Vision tutorial on the Roboflow Blog. Check it out for deeper explanations and context!
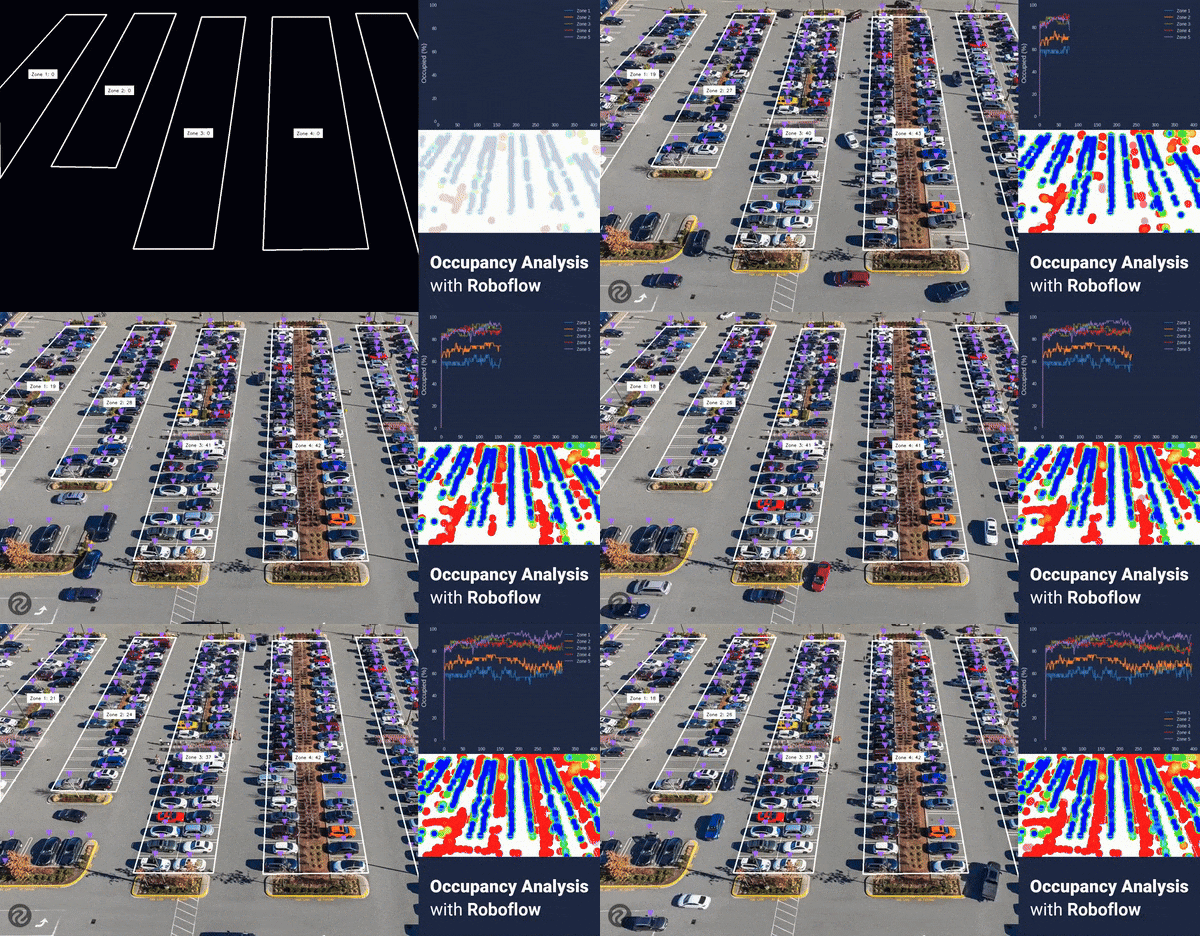
In this notebook, we will cover the following:
- Getting training data
- Training a object detection model
- Detect vehicles
- Analyze data and generate statistics
In [ ]:
!nvidia-smiIn [ ]:
!pip install roboflow supervision -qIn [ ]:
VIDEO_PATH = "/content/parkinglot1080.mov"In [ ]:
import os
FRAMES_DIR = "/content/frames"
os.mkdir(FRAMES_DIR)In [ ]:
import supervision as sv
from PIL import Image
frames_generator = sv.get_video_frames_generator(VIDEO_PATH)
for i, frame in enumerate(frames_generator):
img = Image.fromarray(frame)
img.save(f"{FRAMES_DIR}/{i}.jpg")
print(f"Saved frames to {FRAMES_DIR}")Saved frames to /content/frames
In [ ]:
# Note: This code block was written by ChatGPT
import os
import random
from PIL import Image
import numpy as np
# import shutil
# shutil.rmtree("augmented")
def random_crop(img):
width, height = img.size
crop_width = random.randint(int(width * 0.1), int(width * 0.4))
crop_height = random.randint(int(height * 0.1), int(height * 0.4))
left = random.randint(0, width - crop_width)
top = random.randint(0, height - crop_height)
return img.crop((left, top, left + crop_width, top + crop_height))
def augment_images(source_folder, target_folder, num_images=100):
if not os.path.exists(target_folder):
os.makedirs(target_folder)
all_images = [file for file in os.listdir(source_folder) if file.endswith('.jpg')]
selected_images = np.random.choice(all_images, size=min(num_images, len(all_images)), replace=False)
for i, filename in enumerate(selected_images):
with Image.open(os.path.join(source_folder, filename)) as img:
cropped_img = random_crop(img)
cropped_img.save(os.path.join(target_folder, f'augmented_{i}.jpg'))
# Paths to the source and target folders
source_folder = '/content/frames'
target_folder = '/content/augmented'
# Augment images
augment_images(source_folder, target_folder)
In [ ]:
# Upload the extracted frames to Roboflow
import os
import roboflow
rf = roboflow.Roboflow(api_key="YOUR_ROBOFLOW_API_KEY")
project = rf.workspace().project("parking-lot-occupancy-detection-eoaek")
for filename in os.listdir(FRAMES_DIR):
img_path = os.path.join(FRAMES_DIR, filename)
if os.path.isfile(img_path):
project.upload(image_path=img_path)loading Roboflow workspace... loading Roboflow project...
In [ ]:
# PASTE CODE FROM ROBOFLOW HEREIn [ ]:
from roboflow import Roboflow
import supervision as sv
import numpy as np
import cv2
rf = Roboflow(api_key="YOUR_ROBOFLOW_API_KEY") # Get your own API key - This one won't work
project = rf.workspace().project("parking-lot-occupancy-detection-eoaek")
model = project.version("5").model
def callback(x: np.ndarray) -> sv.Detections:
result = model.predict(x, confidence=25, overlap=30).json()
return sv.Detections.from_inference(result)loading Roboflow workspace... loading Roboflow project...
In [ ]:
# Polygons From PolygonZone
zones = [
{
'name': "Zone 1",
'polygon': np.array([[229, 50],[-3, 306],[1, 614],[369, 50]]),
'max': 32
},
{
'name': 'Zone 2',
'polygon': np.array([[465, 46],[177, 574],[401, 578],[609, 46]]),
'max': 38
},
{
'name': 'Zone 3',
'polygon': np.array([[697, 58],[461, 858],[737, 858],[849, 58]]),
'max': 46
},
{
'name': 'Zone 4',
'polygon': np.array([[941, 58],[909, 862],[1273, 858],[1137, 58]]),
'max': 48
},
{
'name': 'Zone 5',
'polygon': np.array([[1229, 46],[1501, 1078],[1889, 1078],[1405, 46]]),
'max': 52
}
]In [ ]:
tracker = sv.ByteTrack()
slicer = sv.InferenceSlicer(
callback=callback,
slice_wh=(800, 800),
overlap_ratio_wh=(0.2, 0.2),
thread_workers=10,
iou_threshold=0.2
)
triangle_annotator = sv.TriangleAnnotator(
base=20,
height=20
)
heat_map_annotator = sv.HeatMapAnnotator()
def setup_zones(frame_wh):
if zones:
for zone in zones:
zone['history'] = []
zone['PolygonZone'] = sv.PolygonZone(
polygon=zone['polygon'],
frame_resolution_wh=frame_wh
)
zone['PolygonZoneAnnotator'] = sv.PolygonZoneAnnotator(
zone=zone['PolygonZone'],
color=sv.Color.WHITE,
thickness=4,
)
def process_frame(frame,heatmap=None):
detections = slicer(image=frame)
detections = tracker.update_with_detections(detections)
annotated_frame = frame.copy()
annotated_frame = triangle_annotator.annotate(
scene=annotated_frame,
detections=detections
)
if heatmap is None:
heatmap = np.full(frame.shape, 255, dtype=np.uint8)
heat_map_annotator.annotate(
scene=heatmap,
detections=detections
)
if zones:
for zone in zones:
zone_presence = zone['PolygonZone'].trigger(detections)
zone_present_idxs = [idx for idx, present in enumerate(zone_presence) if present]
zone_present = detections[zone_present_idxs]
zone_count = len(zone_present)
zone['history'].append(zone_count)
annotated_frame = zone['PolygonZoneAnnotator'].annotate(
scene=annotated_frame,
label=f"{zone['name']}: {zone_count}"
)
# Heatmap
heatmap = zone['PolygonZoneAnnotator'].annotate(
scene=heatmap,
label=" "
)
return annotated_frame, heatmapIn [ ]:
image = cv2.imread("./frames/5.jpg")
image_wh = (image.shape[1],image.shape[0])
setup_zones(image_wh)
annotated_image, heatmap = process_frame(image)
sv.plot_image(annotated_image)
sv.plot_image(heatmap)(1920, 1080)


In [ ]:
# Credit to https://matplotlib.org/matplotblog/posts/matplotlib-cyberpunk-style/ for graph styles
%matplotlib agg
import pandas as pd
import matplotlib.pyplot as plt
from PIL import Image
from io import BytesIO
def generate_graphs(max_frames):
plt.ioff()
# Plot Styles
plt.style.use("seaborn-dark")
for param in ['figure.facecolor', 'axes.facecolor', 'savefig.facecolor']:
plt.rcParams[param] = '#212946'
for param in ['text.color', 'axes.labelcolor', 'xtick.color', 'ytick.color']:
plt.rcParams[param] = '0.9'
dataframe = pd.DataFrame()
graphs = {}
for zone in zones:
percentage_history = [(count/zone['max'])*100 for count in zone['history']]
dataframe[zone['name']] = percentage_history
plt.title(f'{zone["name"]} Usage')
# Extra Styles
fig, ax1 = plt.subplots()
ax1.grid(color='#2A3459')
# Data
ax1.plot(zone["history"])
# Axis Labeling
plt.ylabel('Vehicles')
plt.ylim(top=zone["max"])
plt.xlim(right=max_frames)
ax2 = ax1.twinx()
ax2.set_ylabel('Occupied Percentage (%)')
# Export Graph Image
buf = BytesIO()
fig.savefig(buf, format='png', bbox_inches='tight', pad_inches=0)
buf.seek(0)
graphs[zone['name']] = Image.open(buf)
plt.close(fig)
plt.ioff()
dataframe.plot()
# Axis
plt.ylabel('Occupied (%)', fontsize=15)
plt.ylim(top=100)
plt.xlim(right=max_frames)
# Export combined
buf = BytesIO()
plt.savefig(buf, format='png', bbox_inches='tight')
buf.seek(0)
plt.close()
graphs['combined_percentage'] = Image.open(buf)
return graphsIn [ ]:
generate_graphs(400)['combined_percentage']
In [ ]:
VIDEO_PATH = "/content/parkinglot1080.mov"
MAIN_OUTPUT_PATH = "/content/parkinglot_annotated.mp4"
frames_generator = sv.get_video_frames_generator(source_path=VIDEO_PATH)
video_info = sv.VideoInfo.from_video_path(video_path=VIDEO_PATH)
setup_zones(video_info.resolution_wh)
with sv.VideoSink(target_path=MAIN_OUTPUT_PATH, video_info=video_info) as sink:
heatmap = None
for i, frame in enumerate(frames_generator):
print(f"Processing frame {i}")
# Infer
annotated_frame, heatmap = process_frame(frame, heatmap)
# Save the latest heatmap
Image.fromarray(heatmap).save(f"/content/heatmap/{i}.jpg")
# Create Graphs
graphs = generate_graphs(video_info.total_frames)
graph = graphs["combined_percentage"].convert("RGB")
graph.save(f"/content/graphs/{i}.jpg")
# sv.plot_image(annotated_frame)
# Send as frame to video
sink.write_frame(frame=annotated_frame)Processing frame 0
Processing frame 1
Processing frame 2
Processing frame 3
Processing frame 4
Processing frame 5
Processing frame 6
Processing frame 7
Processing frame 8
Processing frame 9
Processing frame 10
...
In [ ]:
import cv2
def create_videos_from_dir(dir,output):
images = len(os.listdir(dir))-1
sample_img_path = os.path.join(dir,f"1.jpg")
sample_img = cv2.imread(sample_img_path)
height, width, channels = sample_img.shape
video_info = sv.VideoInfo(width=width,height=height,fps=24,total_frames=images)
with sv.VideoSink(target_path=output, video_info=video_info) as sink:
for i in range(images):
path = os.path.join(dir,f"{i}.jpg")
img = cv2.imread(path)
sink.write_frame(frame=img)
# Graphs
create_videos_from_dir("/content/graphs","/content/parkinglot_graph.mp4")
# Heatmap
create_videos_from_dir("/content/heatmap","/content/parkinglot_heatmap.mp4")In [ ]:
import pickle
with open('parkinglot_zonedata.pkl', 'wb') as outp:
pickle.dump(zones, outp, pickle.HIGHEST_PROTOCOL)In [ ]:
with open('parkinglot_zonedata.pkl', 'rb') as inp:
zones_imported = pickle.load(inp)
zones = zones_importedIn [ ]:
import statistics
for zone in zones:
occupancy_percent_history = [(count/zone['max'])*100 for count in zone['history']]
average_occupancy = round(statistics.mean(occupancy_percent_history))
median_occupancy = round(statistics.median(occupancy_percent_history))
highest_occupancy = round(max(occupancy_percent_history))
lowest_occupancy = round(min(occupancy_percent_history))
print(f"{zone['name']} had an average occupancy of {average_occupancy}% with a median occupancy of {median_occupancy}%.")Zone 1 had an average occupancy of 60% with a median occupancy of 59%. Zone 2 had an average occupancy of 69% with a median occupancy of 68%. Zone 3 had an average occupancy of 85% with a median occupancy of 85%. Zone 4 had an average occupancy of 85% with a median occupancy of 85%. Zone 5 had an average occupancy of 91% with a median occupancy of 92%.
In [ ]:
lot_history = []
for zone in zones:
for idx, entry in enumerate(zone['history']):
if(idx >= len(lot_history) or len(lot_history)==0): lot_history.append([])
lot_history[idx].append(zone['history'][idx]/zone['max'])
lot_occupancy_history = [sum(entry)/len(entry)*100 for entry in lot_history]
average_occupancy = round(statistics.mean(lot_occupancy_history))
median_occupancy = round(statistics.median(lot_occupancy_history))
highest_occupancy = round(max(lot_occupancy_history))
lowest_occupancy = round(min(lot_occupancy_history))
print(f"The entire lot had an average occupancy of {average_occupancy}% with a median occupancy of {median_occupancy}%.")The entire lot had an average occupancy of 78% with a median occupancy of 78%.
In [ ]:
print(lot_occupancy_history)
# [
# ...
# 73.51691310215338,
# 73.34063105087132,
# 73.86694684034501,
# ...
# ][0.0, 73.6265622249604, 73.51691310215338, 73.34063105087132, 73.86694684034501, 73.81677961626474, 74.2515622249604, 74.55142873907177, 74.34309540573842, 76.10547585518981, 75.33624508595904, 75.19454468110075, 74.56954468110075, 74.2334462829314, 74.07528017367835, 74.29457841929236, 74.08624508595905, 74.95162970134366, 75.19619491873496, 75.78914363668368, 76.15564307927008, 75.53779410901838, 75.6293272897964, 75.43910989849205, 76.54025846388546, 76.54025846388546, 77.77632312386316, 76.71654051516751, 77.70969019538813, 78.09430558000352, 77.13320718183418, 78.25247168925658, 79.48853634923428, 78.42875374053864, 78.28452297130787, 77.51782256644957, 78.28452297130787, 77.65952297130787, 78.60250542744822, 79.33715455025524, 79.33715455025524, 78.81083876078155, 78.66913835592325, 78.57045414539694, 78.04413835592325, 77.70803995775391, 77.60935574722761, 77.08303995775391, 77.70803995775391, 77.20662442058324, 78.11755559467231, 77.20662442058324, 77.20662442058324, 78.02602241389427, 77.20662442058324, 77.20662442058324, 78.21623980519861, 77.20662442058324, 76.53860822625124, 76.68030863110955, 76.92069324649417, 77.81768908056092, 76.68030863110955, 79.78422226133897, 79.01752185648066, 78.7315906823916, 79.25790647186528, 78.7315906823916, 78.1065906823916, 77.79957313853194, 77.08303995775391, 76.90675790647185, 77.64140702927888, 77.94842457313852, 77.2707269846858, 78.92345831133017, 78.5067916446635, 76.77811271489762, 78.07365927360208, 78.42622337616618, 79.27767265152849, 79.61212081206361, 81.54146863815058, 81.01515284867688, 80.1472378689198, 80.7541219268908, 79.0098574194684, 80.16117320894209, 79.74450654227543, 78.78340814410608, 79.88873731150619, 80.01947280408379, 80.35392096461891, 79.69851992020185, 79.31390453558646, 79.69851992020185, 80.08313530481722, 80.32351992020186, 79.69851992020185, 79.66646863815056, 80.49980197148389, 79.8706213694772, 78.86100598486182, 78.68725429795222, 80.46357008742592, 78.49703690664789, 78.35280613741712, 80.70813530481722, 80.27335269612156, 79.23168602945492, 79.5041219268908, 79.55681951534353, 79.50665229126326, 79.6163014140703, 81.9855659214927, 81.41073314557296, 82.03573314557296, 81.45671976764653, 81.3651865868685, 80.03043771636449, 81.374501261515, 81.40908290793874, 81.64946752332337, 82.17578331279704, 83.04534853018835, 82.17578331279704, 81.84386551663441, 80.88276711846505, 82.12979669072347, 80.46775068943262, 81.17034853018833, 80.75368186352169, 79.51761720354398, 81.18428387021063, 80.55928387021063, 79.7259505368773, 79.91616792818166, 80.35095053687732, 79.77446752332335, 79.79258346535234, 79.82463474740362, 80.01485213870797, 79.77446752332335, 79.3578008566567, 78.55651880537464, 78.58857008742592, 79.38985213870797, 79.38985213870797, 78.97318547204131, 78.41481840051634, 78.721835944376, 79.14946752332335, 79.3578008566567, 80.15908290793874, 79.59818547204131, 80.63985213870797, 81.47318547204131, 80.01485213870797, 81.61741624127208, 81.20074957460541, 80.99241624127208, 81.02446752332335, 81.40908290793874, 82.03408290793874, 81.64946752332337, 81.02446752332335, 81.02446752332335, 81.40908290793874, 80.36741624127208, 80.77014756791645, 80.86883177844277, 80.24383177844277, 81.01053218330107, 79.474601009212, 80.48421639382738, 80.85071583641377, 79.7103649592208, 80.52558235052514, 79.99926656105146, 80.85071583641377, 79.26461743824443, 79.16593322771813, 78.36465117643607, 78.78131784310274, 78.78131784310274, 79.19798450976941, 79.74241624127207, 81.20074957460541, 79.93263363257641, 79.38820190107376, 79.88961743824443, 79.67413307516283, 79.56448395235581, 79.14781728568914, 78.63246640849616, 78.2157997418295, 78.74926656105147, 78.36465117643607, 78.78131784310274, 79.16593322771813, 78.9575998943848, 79.5825998943848, 78.22295077157777, 78.73115061902247, 78.62150149621544, 78.1867188875198, 77.77005222085313, 78.20483482954879, 78.1727835474975, 77.78816816288212, 78.09518570674176, 78.20483482954879, 77.71057032212639, 79.0562841049111, 78.62150149621544, 80.52558235052514, 79.47295077157777, 78.11330164877074, 78.28958370005282, 78.00365252596374, 77.20237047468169, 78.20483482954879, 77.58698585929707, 77.58698585929707, 77.6785190400751, 77.6785190400751, 78.58945021416417, 77.61188611160007, 78.12723698879304, 75.51758786598603, 75.08280525729039, 78.24403714134836, 76.3234905826439, 77.37612216159127, 77.23442175673296, 77.76073754620666, 78.30516927770933, 76.52467288622894, 76.03040837880654, 76.04852432083553, 76.86792231414657, 75.85665669189696, 75.90517367834302, 77.24373643137945, 77.00797248137064, 78.44521944493339, 77.77467288622894, 76.7148902775333, 77.53428827084431, 77.72450566214869, 76.1885744880596, 75.53152320600833, 76.01229243677756, 74.26802792935516, 74.34309540573842, 76.700954937511, 75.29575925599954, 74.87194155958458, 75.94565950830253, 75.32065950830254, 75.16249339904945, 75.91360822625126, 75.88155694419997, 77.14967288622894, 77.29137329108724, 76.56603884292672, 75.07609429091121, 76.80642345831133, 76.38975679164466, 77.09950566214869, 77.90078771343074, 77.0674543800974, 76.10635598192805, 77.74515196855015, 78.58945021416417, 78.74761632341725, 77.83668514932818, 77.66205333568033, 78.97153523440709, 76.8426553423693, 77.11762160417767, 76.73300621956228, 76.90928827084433, 78.01758786598603, 77.28972305345303, 76.36485653934166, 77.6924543800974, 78.63543683623774, 77.41748811828903, 76.78152320600834, 75.35524115472627, 77.16360822625126, 77.07207504547323, 75.98024115472629, 76.49559203191927, 75.64414275655695, 76.35389162706097, 75.19542480783899, 76.36485653934166, 76.46354074986797, 77.97838555418647, 77.71057032212639, 78.07706976471279, 77.11597136654345, 78.60338555418647, 78.50470134366016, 79.03816816288212, 80.36576600363784, 76.60777151909876, 77.54360294549082, 76.63267177140176, 79.22838555418647, 77.97838555418647, 78.27146775802383, 80.78243267030452, 76.76593762835181, 78.57430469987679, 78.1757539752391, 77.35635598192806, 77.35635598192806, 78.74508595904477, 77.8341547849557, 78.86188611160007, 76.89117232881536, 77.55918852314733, 78.36762160417766, 77.19818987267499, 77.63297248137064, 77.63297248137064, 76.43992401572494, 76.92322361086663, 77.43142345831131, 76.48844100217099, 75.82207504547321, 79.310604060318, 79.310604060318, 78.78428827084433, 79.2119198497917, 77.63297248137064, 78.25082145162237, 79.07021944493339, 79.07021944493339, 78.21877016957109, 76.34674059731267, 77.84130581470399, 77.25767177140176, 78.02437217626006, 77.49805638678637, 76.48844100217099, 77.06327377809072, 77.06327377809072, 78.9534192923781, 78.3284192923781, 78.12008595904476, 77.49508595904476, 77.33691984979171, 77.67136801032682, 77.26863668368246, 76.71907087953998, 77.22727072698468, 77.12693627882416, 74.78972305345305, 76.03972305345303, 76.71026961215748, 75.5589538226838, 75.65510766883764, 76.08273924778501, 77.04933843806842, 75.62305638678637, 77.04933843806842, 77.5756542275421, 76.56603884292672, 77.2091547849557, 75.52437217626006, 76.98270550959337, 77.74940591445169, 77.99232089420876, 77.60770550959337, 78.42710350290443, 78.04248811828904, 78.3174543800974, 77.17710350290442, 76.68283899548202, 76.5841547849557, 76.5951196972364, 75.27049228422226, 74.43297834888224, 74.86776095757789, 74.51057618963797, 77.22727072698468, 76.21600510473507, 77.48412104676406, 76.84815613448336, 77.04933843806842, 76.9506542275421, 77.99232089420876, 76.98270550959337, 75.52734260400165, 75.8132737780907, 77.93962330575603, 76.74529132195038]
In [ ]:
%matplotlib inline
import matplotlib.pyplot as plt
fig, ax1 = plt.subplots()
plt.title('Total Lot Usage')
ax1.grid(color='#2A3459')
ax1.plot(lot_occupancy_history)
ax1.set_ylabel('Occupied Percentage (%)')
plt.ylim(top=100)
plt.xlim(right=len(lot_occupancy_history))
plt.show()
In [ ]:
import cv2
import numpy as np
def transform_image(image, points):
width = max(np.linalg.norm(points[0] - points[1]), np.linalg.norm(points[2] - points[3]))
height = max(np.linalg.norm(points[0] - points[3]), np.linalg.norm(points[1] - points[2]))
dest_points = np.array([[0, 0], [width - 1, 0], [width - 1, height - 1], [0, height - 1]], dtype="float32")
matrix = cv2.getPerspectiveTransform(points.astype("float32"), dest_points)
transformed_image = cv2.warpPerspective(image, matrix, (int(width), int(height)))
return transformed_image
def generate_top_down_views(frame,show=True):
heatmap = cv2.imread(f"heatmap/{frame}.jpg")
image = cv2.imread(f"frames/{frame}.jpg")
images = []
for zone in zones:
if show: print(f"Occupancy Visualization of {zone['name']}")
top_down_image = transform_image(image, zone['polygon'])
top_down_heatmap = transform_image(heatmap, zone['polygon'])
combined_image = cv2.addWeighted(top_down_image, 0.7, top_down_heatmap, 0.3, 0)
if show: sv.plot_image(combined_image, size=(5,5))
images.append(combined_image)
return images
In [ ]:
generate_top_down_views(400)In [ ]:
import os
import numpy as np
from PIL import Image
import supervision as sv
for filename in os.listdir("frames"):
img_path = os.path.join("frames", filename)
heatmap_path = os.path.join("heatmap", filename)
if os.path.isfile(img_path) and os.path.isfile(heatmap_path):
frame = int(filename.replace(".jpg",""))
images = generate_top_down_views(frame,False)
gap = 10
pil_images = [Image.fromarray(image) for image in images]
# Resize images to have the same width
widths, heights = zip(*(i.size for i in pil_images))
max_width = max(widths)
total_height = sum(heights) + gap * (len(images) - 1)
resized_images = [i.resize((max_width, int(i.height * max_width / i.width))) for i in pil_images]
# Create a new image with the correct combined size
combined_image = Image.new('RGB', (max_width, total_height))
# Paste each image into the combined image with the specified gap
y_offset = 0
for img in resized_images:
combined_image.paste(img, (0, y_offset))
y_offset += img.height + gap
combined_image = combined_image.rotate(90, expand=True)
combined_image.save(f"sectionheatmaps/{frame}.jpg")
sv.plot_image(np.array(combined_image))


